


A lot of novice traders get confused when they enter the field of technical analysis, as they face all these rather complex indicators. The best advice one can give a newbie in such a situation is to put quality over quantity. What do I mean by that? Test a bunch of indicators and write down how effective each of them is. An even better option could be to test how well every one of them performed on existing data, which means looking at numerous price graphs and evaluating whether the signal a particular indicator formed was right or wrong (that is, backtesting). Having finished testing, choose just a few of those, which had worked the best for you and of course, if you find out later on that any don’t work as expected, feel free to update the list as you develop your expertise.
One of the indicators that I really deeply encourage you to use is the Relative strength index (RSI), that I’ll talk about today. First I’ll spend some time explaining what it is fundamentally and afterwards I’ll dive deep into practical applications of it. My firm belief that knowing how to use it in practice is of utmost importance is the predominant reason for not including the fairly complex mathematical background (besides, you’re not here for that).
The RSI is an oscillator used in technical analysis, which measures the magnitude of recent price changes to evaluate overbought or oversold conditions in the price. Its value ranges from 0 to 100. Traditionally values above 70% indicate that an asset is becoming overbought (overvalued), while values below 30% indicate that it is getting into oversold (undervalued) territory. Both signs indicate that either a correction in a price or trend reversal is on the way.
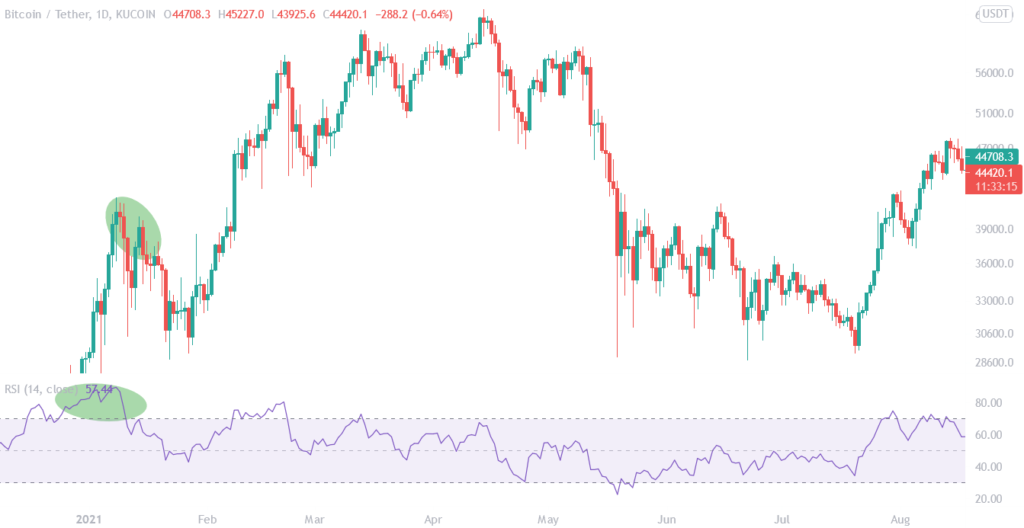
Basically, under normal circumstances, when the price is in a sideways movement, we interpret RSI under 30% as a bullish sign and RSI exceeding 70% as a bearish sign. In case of a strong overall trend on a longer timeframe we need to adapt thresholds. In case of a strong long term upward trend, we move them higher, in contrast to moving them lower in case of prevailing downward trend. Such a phenomenon can be obtained from the following picture. Since it’s difficult to evaluate when and how much to move thresholds, RSI is most useful when the price moves in a horizontal direction long-term.
It’s of vital importance to look for sharp changes in the RSI value in order to spot trend reversal. In case of a bullish trend, when the RSI fluctuates around higher values and repeatedly exceeds 70%, the sharp fall to 30% indicates a weakness in a trend and signals reversal of a trend. On the flip side, during bearish trend, when the RSI fluctuates around lower values and frequently fails to reach 30%, a sharp increase to 70% is a signal for trend reversal.
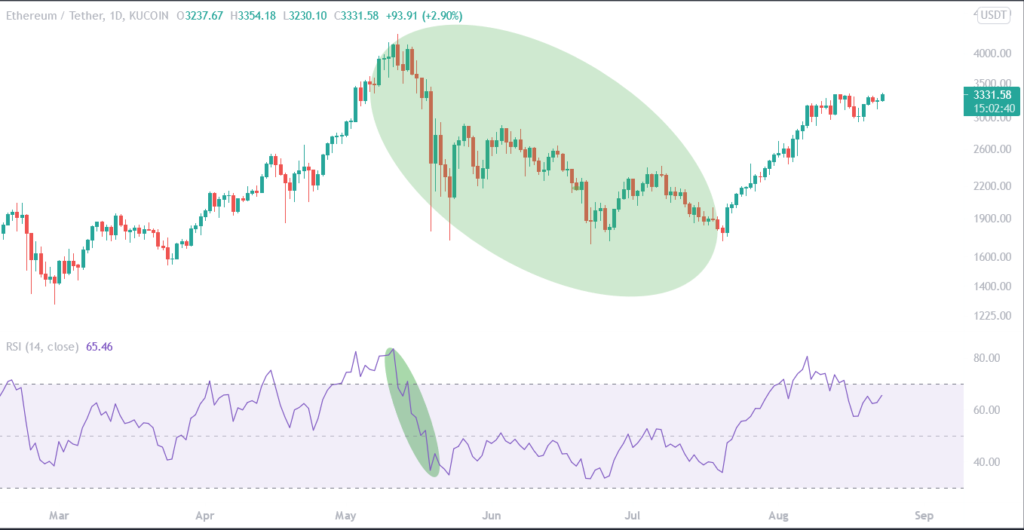
An even superior sign of trend reversal is what we call Bullish divergence, which occurs when the RSI forms higher lows, while the price of an asset forms lower lows. On the contrary, Bearish divergence occurs, when the RSI forms lower highs, as the price of an asset forms higher highs. As the name suggests, the first is a bullish signal, while the latter is a bearish signal for a trader. An instance of a bearish divergence formation can be observed from the picture below.
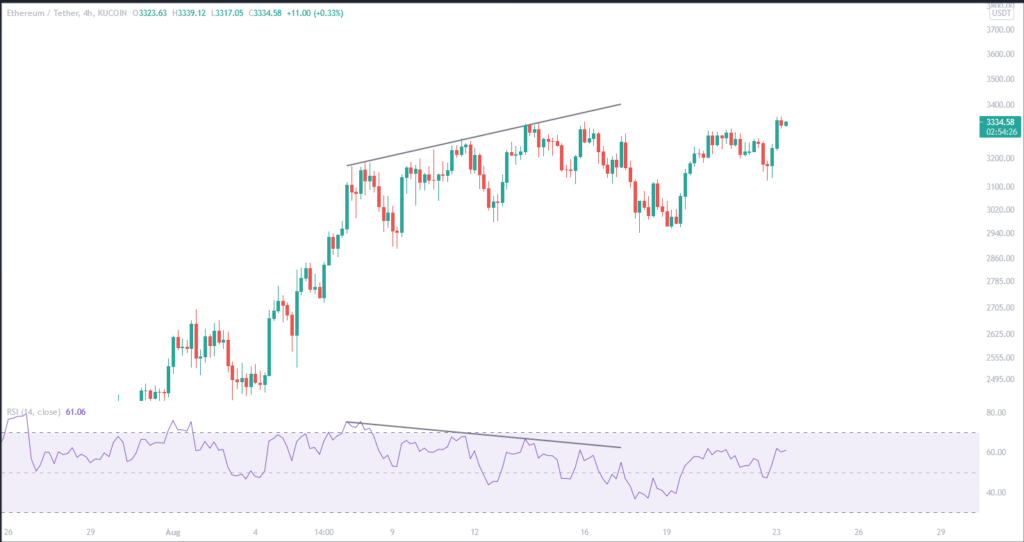
The last RSI signal that can predict trend reversal is called a swing rejection. Bullish swing rejection forms as RSI dips below 30%, once again gets above 30%, makes another dip but doesn’t get into oversold territory and then breaks the prior high. Inversely, a bearish swing rejection forms as RSI gets above 70%, pulls back beneath 70%, makes another high but doesn’t get into overbought territory and then dips below the prior low. The following picture portrays how price reversed soon after the confirmation of a bearish swing rejection.

To sum it up, RSI can be immensely useful, but needs to be used in combination with other indicators. Generally, traders apply it when price has been moving sideways in the long-term, but has been in a short-term trend and they want to predict whether the trend is there to stay or its reversal is on the horizon.
Overall, one thing to consider is that moving averages and other MA-based indicators are typically better when the market is in a strong trend (e.g. for finding entry and exit points), while oscillators such as the RSI and Stochastics (I can cover this one later on people are interested) are better in ranging markets.


Hi Blood!
I like using the 4h RSI bullish divergence as an entry, but I have more doubts about when to exit, specially when the upside is very overextended. If I wait too much until it breaks down 21EMA, for example, I could “lose” a lot of gains. And not always you can find a bearish divergence exit signal. Do you have any exit advice? I use to swing trade. So if I have a good coin I like to short it.
Thanks
Very excellent, thank you so much dude!
THANK YOU I’ve been trying to understand RSI for a while now and this has been the best explanation by far! Really appreciate what you do man, keep them coming! you are really helping many of us out here.