


Bloodgang,
Welcome to the fifteenth issue of Bloodgood’s notes. The idea of this newsletter is to give you an overview of the previous week’s fundamentals and what happened on charts as well as to remind you of this week’s articles, secret TA tips, and trading calls. Basically, it’s about giving you all the key info in one place.
Table of contents
- Fundamental overview
- Bitcoin and Ethereum chart
- Blood’s content recap
- Concluding notes
As this community grows, I have a duty to give back to all of you that helped me and supported me to become what I am. This free newsletter is just another way to share my experiences and prepare you for the journey that’s ahead of you.
Love,
Blood
Fundamental overview
If you read last week’s newsletter, you shouldn’t be surprised to see that the Ukraine situation is completely defining the markets. Yesterday, Russia recognized the independence of two breakaway regions in eastern Ukraine, dramatically increasing tensions. With many European countries, as well as the US, set to announce sanctions today, it’s likely we’ll see more volatility as the situation unfolds.
Unsurprisingly, this sort of thing typically sends risk-on assets like tech stocks into a nosedive, while oil and gold are rallying hard. As for Bitcoin, it remains to be seen how the market will treat it: while I do think that it will be correlated with the S&P 500 at first, the longer-term consequences aren’t clear at all. Sure, most people see it as an (extremely) risk-on investment, but maybe this is the sort of global turmoil that is necessary for Bitcoin to be seen for what it is: sound money that’s not dependent on any single government in the world (not to mention being way easier to transport than gold, especially in times of conflict). Maybe, just maybe, this sort of thing will happen if there’s more conflict and Bitcoin will become as ubiquitous as gold – essentially leading to “hyperbitcoinization,” but not the kind that people were expecting. In any case, these sorts of considerations should definitely influence your long-term investment strategy, but not your shorter-term trades. For that, always focus on the charts.
Bitcoin
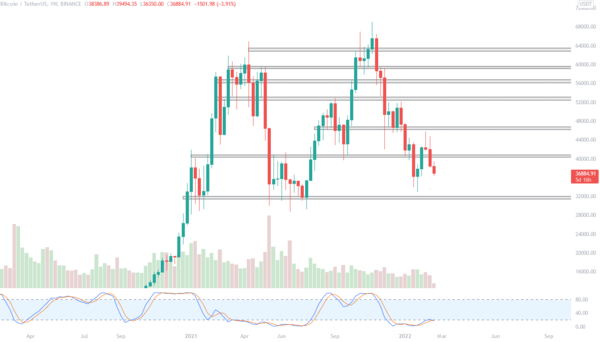
Bitcoin/Dollar Weekly chart
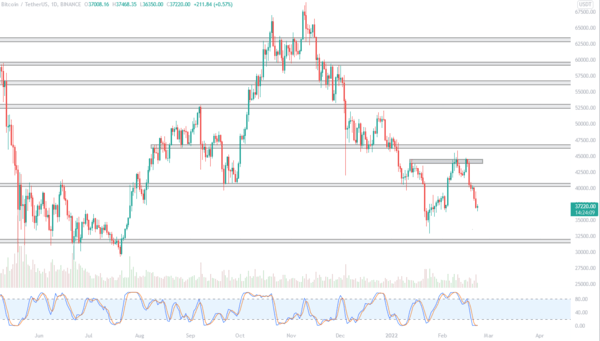
Bitcoin/Dollar Daily chart
Bitcoin was rejected at a key weekly level and dipped below $37,000.
At the time of writing, Bitcoin is trading at $36,800, and in the previous newsletter, we discussed a bearish candle formation on the weekly structure, namely a shooting star, which played out resulting in a ~15% red weekly candle. Another important indicator to look at at this point is volume which has been slowly but steadily dropping indicating that buying power is weakening. Also, the stoch looks like it’s being rejected at the 20 level, which is another bearish sign.
Looking at the daily chart, I drew a zone which I believe was the “trouble area” for bitcoin to close above. Although we tested the weekly $46,000 level where it got immediately rejected, I believe that the zone I drew was a better short entry and should be monitored in case we revisit those levels. Even though this crash was more sentiment-driven, some levels were still respected and there was a good short opportunity if you were paying attention.
That being said, Bitcoin is currently in a 3D demand area, which could be a great place to start bidding unless a massive shitshow happens in Ukraine. I will be slowly bidding Bitcoin spot in the 3D demand, and if that is lost, I will be looking towards the May levels, $30,000-$32,000.
Ethereum
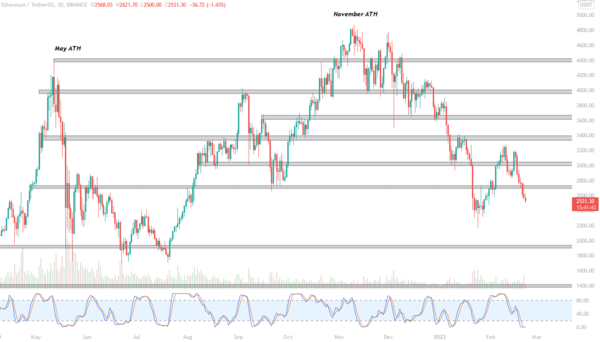
Ethereum/Dollar Daily chart
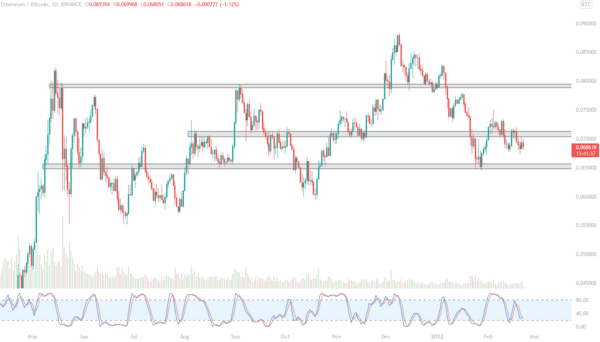
Ethereum/Bitcoin Daily chart
Ethereum loses the $2700 level, the next key weekly level is $1700.
Vitalik’s coin is not that interesting lately as it copies Bitcoin’s price action: also, although many still argue we are not in a bear market, Vitalik claims that a crypto winter will help the industry become stronger and purge weak and overhyped projects.
Charts wise, if we look at the key weekly levels, after losing the $2700 level, the next key level lies at $1700-$1900. Of course, similar to Bitcoin, Ethereum also has a 3D demand lying right below where it currently trades and I will bid that level. Again, it would be smart to place SL below that zone in case the Ukraine situation heats up.
Checking the eth/btc pair, it looks like the key level was defended around January 22nd along with a temporary reclaim of the important 0.07btc level. At the moment it is fighting with that important level and trading right below, however I don’t think it will detach from Bitcoin at this point and we should focus more on BTC than ETH.
Blood’s content recap
Secret tip
#28
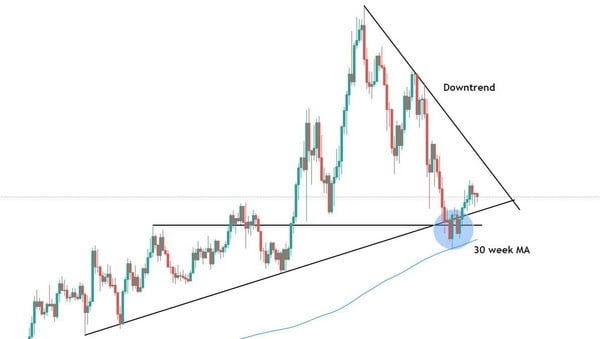
“Secret to finding the bottom.
Look for a retest of the 30 week MA below obvious areas of support.
Price likes to fakeout from obvious support levels and finds a bottom below them at the MA before a reversal”
Secret tip #28
#29
“Traders often draw too many lines, not knowing when/where to pull the trigger.
Here is my secret to drawing SR zones.
Before I draw a zone I ask myself “If price dumps/pumps to this level would I Buy/Sell?
If yes, draw a line.
If no, ignore the level.
Don’t overcomplicate.”
Concluding notes
Overall, this is a sentiment-driven market, and the only way to not get rekt is to not be a sentimental trader yourself. Regardless of the key levels on the chart, never forget that escalation in Ukraine could wipe you out with the mother of all wicks – even if your mid to long-term thesis is completely correct. Having tight stop losses or even staying away from leverage trading entirely are good strategies right now, since otherwise you’ll run out of ammo even if a few bullets are fired in Ukraine.

