


Bloodgang,
Welcome to the eighteenth issue of Bloodgood’s notes. The idea of this newsletter is to give you an overview of the previous week’s fundamentals and what happened on charts as well as to remind you of this week’s articles, secret TA tips, and trading calls. Basically, it’s about giving you all the key info in one place.
Table of contents
- Fundamental overview
- Bitcoin and Ethereum chart
- Blood’s content recap
- Concluding notes
As this community grows, I have a duty to give back to all of you that helped me and supported me to become what I am. This free newsletter is just another way to share my experiences and prepare you for the journey that’s ahead of you.
Love,
Blood
Fundamental overview
Inflation has always been a hot topic in the crypto community, but it seems that the rest of the world is also catching up to how important it is. The Consumer Price Index data for February was released last week, and it showed 7.9% year-over-year inflation, the highest level in 40 years. Incidentally, that’s more or less the only chart in all of traditional finance that’s currently pretty much vertical – at least the only one that’s heading up vertically (along with USDRUB, that is).
What does this mean for the markets? Well, we’ll see which way things will go very soon, with the next Fed meeting just a couple of days away. Rate hikes are now inevitable, and the only question is how severe and how soon they will come. A 50 bps (basis points; 0.5%) rate hike was all but priced in before the start of the Ukraine conflict, but geopolitical unrest has complicated matters quite a bit. This is visible on the charts as well, and the bottom line (unless you happen to enjoy this choppy boring PA) is to wait for the meeting to be over to see which way the markets will turn.
Bitcoin
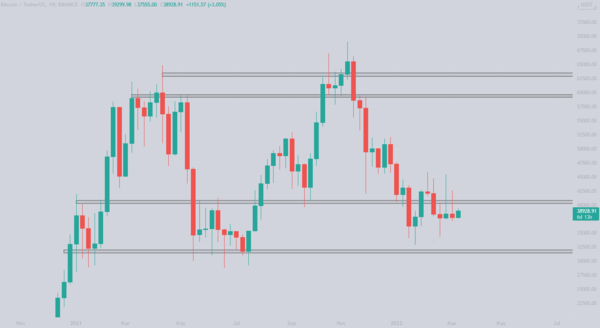
Bitcoin/Dollar Weekly chart
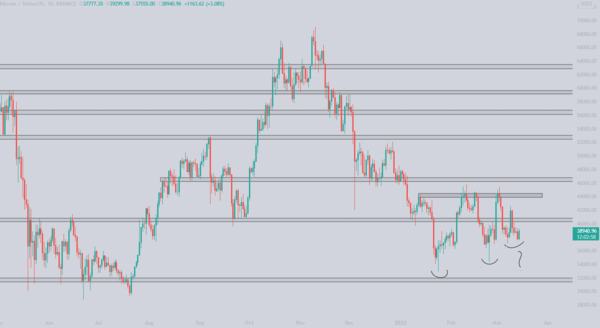
Bitcoin/Dollar Daily chart
Bitcoin continues the $33k-$46k zone chop.
Similar to the week before, (when Bitcoin casually pumped and dumped by 21%), this was a volatile week as well, as Bitcoin formed a low at ~$37,000 and a high at ~$42,600. A 14% price change in 2 days resulted in alts dropping even further, except for Luna, which made new highs.
At the time of writing, Bitcoin is trading at ~$38,900, slightly above the 3D demand we talked about a few weeks ago, which seems to be quite a strong zone for now. However, we still did not get confirmation that the higher low was made, meaning this will be a crucial level to defend in the next few days
Looking at the weekly level we still did not manage to break out of the major lower range and we keep on trading right below it, which could be a phase of bullish accumulation, however if we want to even start talking about continuation to the upside we need to have a weekly close above first. All those reading my newsletter know where my bids are placed in case Bitcoin decides to visit the next logical level, which is $30k-$32k.
On the daily chart we could argue that an ascending triangle is forming, which would mean that we are close to the bottom now and we could once again see $40k+ levels. Since this is a sentiment-driven choppy market, I am not looking to trade on lower timeframes and I am staying away from the market unless any big moves happen.
Ethereum

Ethereum/Dollar Daily chart
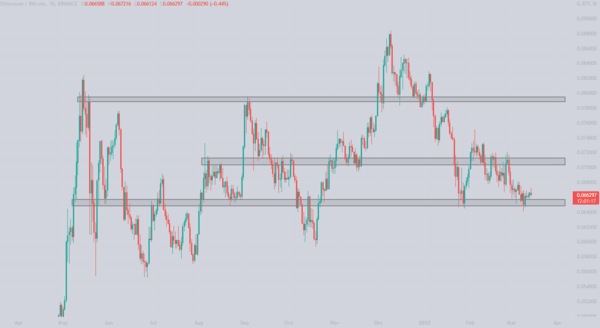
Ethereum/Bitcoin Daily chart
Ethereum continues the downtrend, sitting on the support of the symmetrical triangle.
The ETH/BTC level that I am monitoring and is in my opinion a key level that Ethereum must hold is being defended and the zone looks strong for now. However, the volume is slowly decreasing and there is no sign of a bounce for now. The longer that ETH stays on this level, the higher is the probability of a breakdown, which would be a clear sign that alts will get hammered.
On the USD pair, price action is copying Bitcoin’s movement, however it did respect the $2750 level and got rejected which presented a good short opportunity. Other than that, on a weekly level it is trading right below the May range high, not providing good swing opportunities.
Looking at the bigger picture, ETH presents a good buying opportunity at the $2300 level, upon losing that level I will bid at $1900. In order to see any continuation we need to reclaim the $2700 level and then aim for $3000.
Blood’s content recap
Bitcoin 10 year timeline
“People call for 20k $BTC
Let’s put that into perspective.
In not a single run Bitcoin returned to a previous ATH”
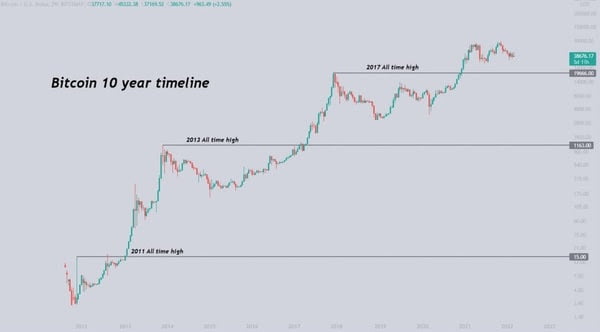
Previous Bitcoin ATH’s
Macro Bitcoin ranges update
“Price action is still respecting accumulation zone that was drawn over a month ago.
Patiently waiting for a breakout, and then we go in a bull mode.”
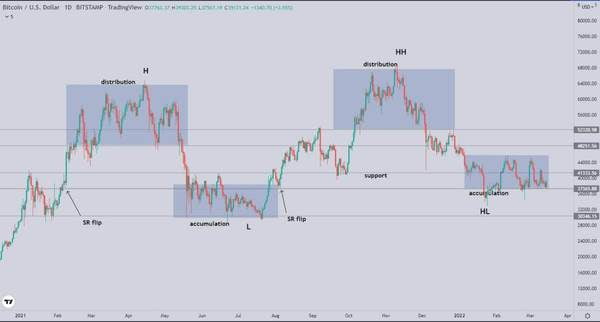
Macro Bitcoin ranges
Concluding notes
Between the choppy PA and all kinds of geopolitical and macroeconomic uncertainty, this is not the time to be overconfident with swing trade setups. Luckily we’re still seeing some occasional altcoin pumps, so there are interesting opportunities if you’re staying up to date with how the narratives are shifting on a lower timeframe.
In any case, remember to long strength and short weakness when we have this kind of an environment with a few alts that are outperforming. Thinking “surely it can’t go up (or down!) any more” is not a trade idea, but just one of the quickest ways to lose money. Stay safe out there – the chop will be over sooner rather than later, and you better be ready when proper setups start showing up.

