
Bloodgang,
Welcome to the nineteenth issue of Bloodgood’s notes. The idea of this newsletter is to give you an overview of the previous week’s fundamentals and what happened on charts as well as to remind you of this week’s articles, secret TA tips, and trading calls. Basically, it’s about giving you all the key info in one place.
Table of contents
- Fundamental overview
- Bitcoin and Ethereum chart
- Blood’s content recap
- Concluding notes
As this community grows, I have a duty to give back to all of you that helped me and supported me to become what I am. This free newsletter is just another way to share my experiences and prepare you for the journey that’s ahead of you.
Love,
Blood
Fundamental overview
The Federal Reserve meeting that everyone was waiting for, and that I mentioned in last week’s newsletter, finally happened. The rate hike was fairly aligned with overall expectations at 25 bps (basis points, so 0.25%), but it seems like analysts are expecting much more rate hikes by the end of the year. Apart from that, Biden signed a $1.5 trillion bill to fund the US government for the rest of the fiscal year, and stocks seem to be bouncing quite a bit.
With that in mind, all eyes are still on the Ukraine situation, as whatever happens there will likely determine how and when the Fed will be able to raise rates more aggressively. At this point, it’s unlikely that inflation will slow down significantly just yet, and we’ll get the data for March on April 12th. This will be especially important, since we’ll see just how much of an impact the geopolitical situation will have on consumer prices.
Bitcoin
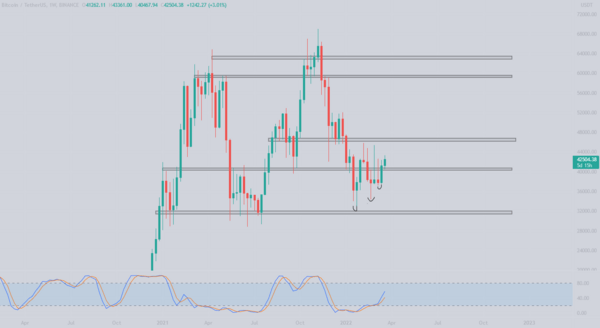
Bitcoin/Dollar Weekly chart
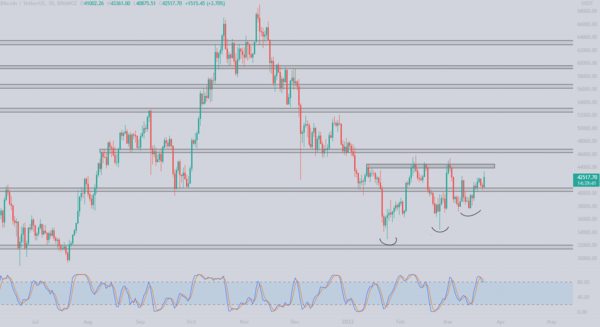
Bitcoin/Dollar Daily chart
Bitcoin is back above $40,000, are we finally breaking above $46,5k?
After constantly getting rejected above the $40k level, leaving three nasty weekly wicks, the last weekly closed above the 40k level which resulted in buyers stepping in once again, pushing Bitcoin to $42.5k at the time of writing. At the weekly level, the next point of resistance is the midline of this $35k-$60k range, which lies at $46,500. Bitcoin approached the resistance 3 times and got rejected heavily indicating that there is a lot of sell pressure. Reclaiming that level would be the first strong sign of continuation.
Looking at the daily level, Bitcoin reclaimed a key level at $40k while giving a chance to enter in a long position as it retested the $40,500 zone only to then give us a 7% pump. The important area to keep your eyes on the daily level is the $44.5k zone where Bitcoin got rejected 4 times since the middle of January. The ascending triangle on the daily also seems to be following the pattern and has approached the resistance. The ascending triangle usually results in a breakout to the upside.
In case the pattern fails, the first level to look at is the $40,500 where we should place our bids, however, if that level is lost we will be looking towards making another higher low which would be around the $38,000 level.
Ethereum
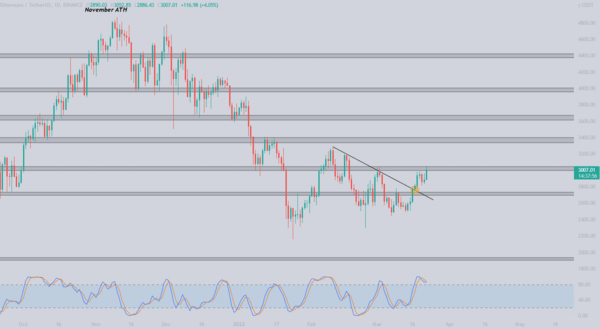
Ethereum/Dollar Daily chart
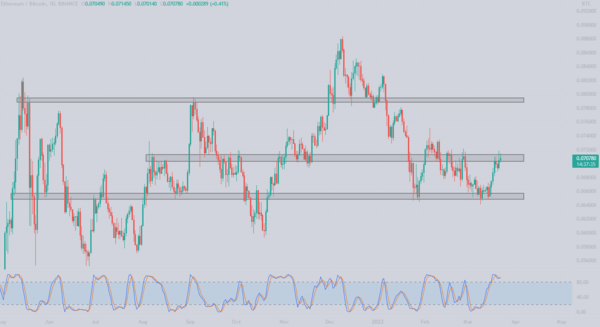
Ethereum/Bitcoin Daily chart
Ethereum touches the $3000 level again
Ethereum finally breaks above the trendline on the USD pair, resulting in a push towards the $3000. After being in a downtrend since November, constantly making lower highs, ETH finally shows some strength. Upon touching the $3k level we got rejected for the first time, but it seems that the bulls are confident this time and at the time of writing ETH is trading above $3000. Will be interested to see if this time we stay above the level.
Looking at the ETH/BTC pair we can see that levels are being respected so far. The 0.065 BTC level was defended once again and ETH is currently trading right below the 0.07 level which seems like a strong resistance as it is being tested for the 4th time.
Both the dollar and bitcoin pairs are currently sitting below resistance, meaning if you bought ETH at lower prices this should be your exit point. Upon exiting you either wait for the lower levels or for the confirmation candle above the resistance levels.
Blood’s content recap
Scalping exercise
“Scalping exercise N°2 – An addition to the previous exercise
- Open naked 15 min chart
- Choose a coin in the top 50
- Add “Stochastic RSI” to the chart
- Line crossover is the trigger.
Practice this for a month. Few more exercises and you are ready to go.”
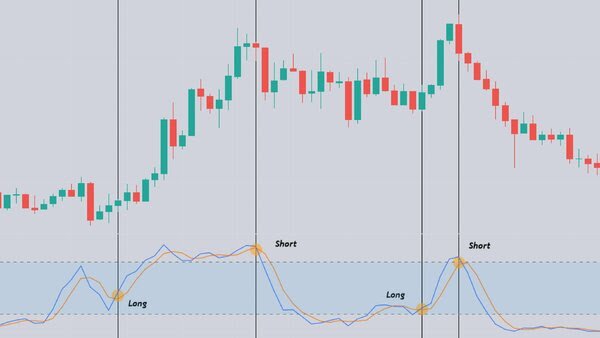
Scalping Exercise
Merch announcement
“I am making high-quality Blood merch
Got a confirmed deal with Champion for hoodies and t-shirts.
Merch is going to be Exclusive, it can’t be bought as it will be meant for Giveaways & Rewards in Blood competitions
It will be a lifestyle type of Merch, revealing pics this week”
Concluding notes
Stocks are recovering nicely, but it remains to be seen whether this is simply a dead-cat bounce. Whatever happens, the correlation between Bitcoin and the S&P 500 isn’t going to disappear just yet – especially in case of geopolitical events that would send stocks tumbling – but I’m more confident than ever that this will happen in the long run. The current monetary system is bursting at the seams, and hard assets will have their time to shine.


