


Bloodgang,
Welcome to the twentieth issue of Bloodgood’s notes. The idea of this newsletter is to give you an overview of the previous week’s fundamentals and what happened on charts as well as to remind you of this week’s articles, secret TA tips, and trading calls. Basically, it’s about giving you all the key info in one place.
Table of contents
- Fundamental overview
- Bitcoin and Ethereum chart
- Blood’s content recap
- Concluding notes
As this community grows, I have a duty to give back to all of you that helped me and supported me to become what I am. This free newsletter is just another way to share my experiences and prepare you for the journey that’s ahead of you.
Love,
Blood
Fundamental overview
While the past week was as news-driven as expected, we’ve seen a decent bounce in US equities on Thursday and Friday, with the S&P 500 closing the weekly candle above the 21 week EMA for the first time since January 15th. This is a very welcome sign of recovery, and holding above this EMA would be extremely good for the global markets in terms of risk-on assets. Plenty of tech stocks that looked half dead have also recovered, but it remains to be seen just how sustained this will be.
Overall, the main reason behind this is that emotional responses to geopolitical events (such as the current war) tend to be short-lived, which is why these bounces (or corrections in gold and oil, for example) aren’t surprising. Mean reversion is a real thing, and that’s one option that we can’t rule out.
As far as Bitcoin is concerned, what everyone is waiting for is the famed decoupling. This hasn’t happened for a while – especially not to the upside – but the sort of behavior we’re seeing just now is extremely encouraging. When that happens, expect Bitcoin to move violently (think late 2020 or early 2021), and this boring correlation with stocks to be over in an instant.
Bitcoin
Bitcoin/Dollar Weekly chart
Bitcoin/Dollar Daily chart
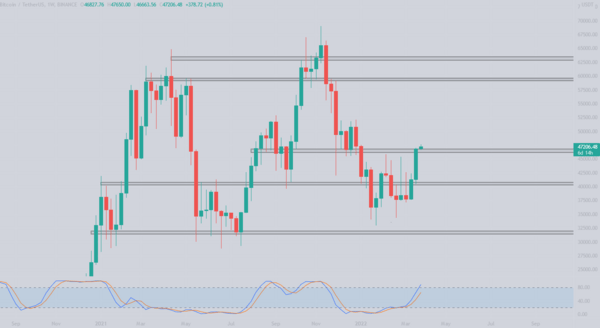
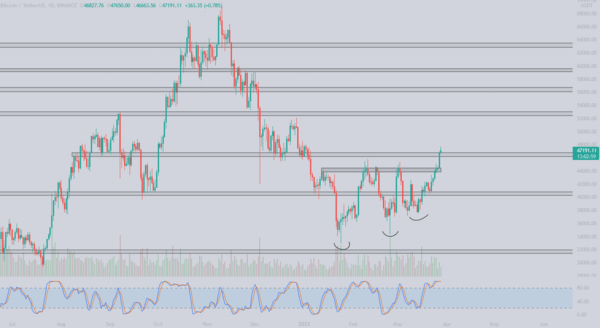
Bullish weekend price action leads Bitcoin to a weekly close above a key level.
Bitcoin had 6 consecutive green daily candles the previous week, at the time of writing it is making a 7th green candle. In the previous newsletter we discussed that buyers could be stepping in as the weekly candle closed above $40k level, indicating we will get another try at the weekly resistance at $46.5k which is the midline of this $35k-$60k range.
This is the fourth time Bitcoin approached it and it managed to close above. This was the level we wanted to reclaim if we wanted to see any bullish continuation, but keep in mind that we can’t exclude the possibility of a fakeout just yet. To be completely safe we should wait for the next weekly candle to close above this level. If your risk appetite is higher you can also observe daily candle closes and after 2 confirmation candles you can look to enter.
Looking at the daily chart, we can see that the resistance at $44.5k which kept rejecting bitcoin was finally broken and the ascending triangle is playing out. We even got a retest of the level on lower time frames (providing good long opportunities) before going higher. Currently Bitcoin is trading right above the key level. I am not trading this until we get a clearer idea what happens here. Ideally, we would get a pump somewhere close to $49k and then retest the $46.5k level and confirm it as support. Only then would I start bidding current levels.
You should also monitor the Stoch RSI before you enter any longs. It’s about to enter into the overbought area on the weekly, whereas the daily has been in the overbought area for quite some time, which could indicate buyer exhaustion.
Ethereum
Ethereum/Dollar Daily chart
Ethereum/Bitcoin Daily chart
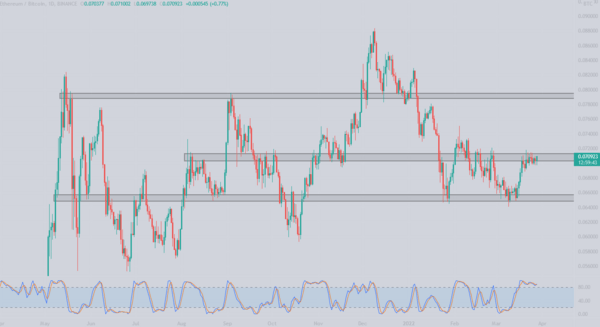
Ethereum follows Bitcoin’s PA and confirms the $3000 level.
After breaking out of the downtrend and getting rejected on the $3k level, ETH finally reclaims the important level and makes a move towards $3350. Currently, we are trading right below it which could present a good opportunity for a short entry. Of course it depends what happens to Bitcoin, upon seeing signs of weakness on Bitcoin and a possibility for a fakeout, I would enter a short here. However, a close above $3350 would present a good long opportunity and a target of $3700. Similar to Bitcoin, the daily Stoch RSI is heavily in the overbought zone, looking for some relief.
Looking at the ETH/BTC chart, we can see that Ethereum has been following Bitcoin and could not yet decouple. As long as this resistance at 0.07btc is not broken I wouldn’t really focus heavily on Ethereum, but I am pretty sure that it will break sooner or later due to the Eth 2.0 merge which should happen in 2022.
Blood’s content recap
Merch giveaway
“Blood Merch giveaway
Champion-made merch is Live and a few loyal Discord members already won theirs
I am Giving away 5 t-shirts and 5 hoodies.
Follow the link below to join You can Always win Free merch in Discord by being active and joining contests”
Yearly recap
“What we built in a year is amazing
Community debates, guidance http://Discord.gg/bloodgang
More charts, longer texts https://t.me/bloodgoodBTC
Trading articles, tips https://bloodgoodbtc.com
Join Non-toxic community, learn & contribute after you learn RT, invite your friends”
Concluding notes
The Bitcoin breakout was a very welcome turn of events, but don’t get overconfident just yet. Overall I’m definitely not seeing signs of the market being too frothy, but a breakout like this could very well lead to some liquidations of late longs, especially if there’s uncertainty in geopolitical events and the stock market. With that in mind, the broader situation is still far more bullish than past week, so there’s reason for optimism. If the famed decoupling happens soon, prepare for Bitcoin to melt faces.

