


Bloodgang,
Welcome to the twenty-second issue of Bloodgood’s notes. The idea of this newsletter is to give you an overview of the previous week’s fundamentals and what happened on charts as well as to remind you of this week’s articles, secret TA tips, and trading calls. Basically, it’s about giving you all the key info in one place.
Table of contents
- Fundamental overview
- Bitcoin and Ethereum chart
- Blood’s content recap
- Concluding notes
As this community grows, I have a duty to give back to all of you that helped me and supported me to become what I am. This free newsletter is just another way to share my experiences and prepare you for the journey that’s ahead of you.
Love,
Blood
Fundamental overview
We’re starting what is likely to be another news-driven week, with all eyes on tomorrow’s CPI numbers for March. This datapoint will be especially significant since it’s the first CPI print that will take into account the full extent of inflation caused by the sanctions against Russia and the resulting supply issues. Most analysts are expecting something around 8.4% inflation, so anything above this would be quite the shockwave for US equities.
In case you’re wondering why higher inflation would be bad for stocks (and for other correlated assets, which still includes crypto whether we like it or not), this is simply because it becomes more obvious that the Fed will have to tighten and raise rates more aggressively. If inflation threatens to really get out of hand, then crashing the stock market and bringing on a recession is still a better choice than hyperinflation, at least from the Fed’s perspective.
Still, this isn’t necessarily that bleak an outlook for crypto: all that needs to happen is for Bitcoin to decouple, that is for the correlation between BTC and tech stocks to drop. This hasn’t happened in a while – at least to a significant degree in terms of duration – but it’s bound to, sooner or later.
In the meantime, though, we’ve seen bullish news lead to weak pumps that only served to trap longs before further drops. This isn’t too surprising with the CPI coming up, however, so it’s definitely advisable to wait for the dust to settle a bit.
Bitcoin
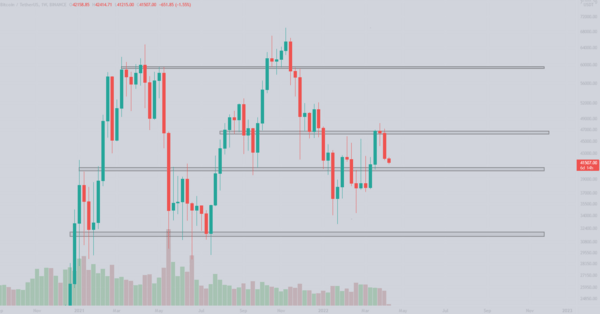
Bitcoin/Dollar Weekly chart
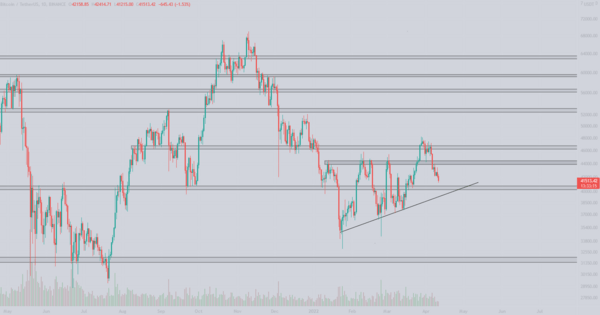
Bitcoin/Dollar Daily chart
Bitcoin drops to the low $41k region after a hard rejection at the key macro level.
Looking at the bigger picture (weekly) we can see that Bitcoin did not manage to reclaim a key level, even though the previous weekly candle closed above $47,000, which we argued was a bullish sign. The next logical weekly level is $40,000 to $41,000 where I expect buyers to step in and defend the level, which of course does not mean we are not going lower, however this is where my bids are placed since we got rejected from $46,500.
On the daily level, we see things even clearer, the $44,500 level which was a major level on the way up did not hold as support. We did get some kind of a pump during the weekend which got rejected by the $44.5k level, but then again, who still trusts weekend pumps? Moving forward, I am monitoring two levels: the first is the key $40k area and the second is the uptrend line. In case we lose $40k, the only hope to maintain a bullish structure is to make a new higher low and defend the uptrend line.
Upon losing these levels I would once again look towards the $32k level which we did not reach in January and February.
On the other hand, given the current situation, with CPI numbers coming tomorrow, volatility is expected and some levels could be ignored, meaning that I would suggest staying away from the markets until we see a clearer direction appear.
Ethereum
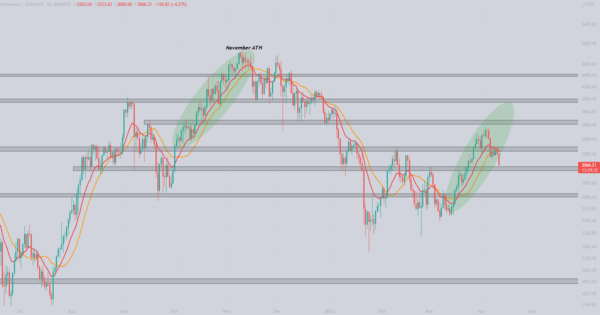
Ethereum/Dollar Daily chart
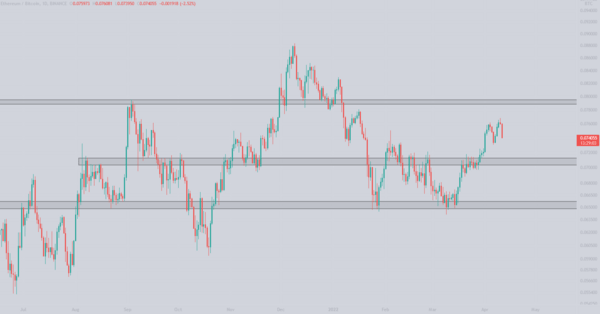
Ethereum/Bitcoin Daily chart
The Ethereum staircase pattern breaks.
After approaching another important level (slightly above $3600) Ethereum got rejected, breaking below the key daily level at $3300 as well as losing both EMA13 and MA20 levels which we argued were important levels to defend if we want to see ETH continue in its staircase pattern. At the time of writing, ETH is trading right above its next key level $3000. Upon losing that level we are looking towards $2700 once again.
After finally showing some strength vs. Bitcoin, Ethereum takes a hit again and is rejected from the 0.077 BTC level. Two levels I am looking at are 0.07-0.071 which is acting as support and 0.079-0.08 which is acting as resistance. As soon as we reclaimed the 0.07 as support, Eth took off and outperformed Bitcoin.
Blood’s content recap
Blood’s tip
“Become a beast at TIME FRAME analysis.
1. Analyse Weekly timeframe to recognize trend direction
2. Chart Daily and 4H timeframes, focus on S/R zones only
3. Set alerts on the key levels
4. Execute a trade when a level is hit
This is the easiest possible way to make money.”
Concluding notes
In times like these, price action can be extremely trappy leading up to an event like the CPI print. Remember, no one knows exactly what the numbers will be, and pretending that you do know is an incredibly quick way to lose money. The only two ways to deal with this are to simply take some time off until the dust starts to settle or to just trade it level by level, focusing on the technicals rather than any macroeconomic hunches.

