


Bloodgang,
Welcome to the twenty-fourth issue of Bloodgood’s notes. The idea of this newsletter is to give you an overview of the previous week’s fundamentals and what happened on charts as well as to remind you of this week’s articles, secret TA tips, and trading calls. Basically, it’s about giving you all the key info in one place.
Table of contents
- Fundamental overview
- Bitcoin and Ethereum chart
- Blood’s content recap
- Concluding notes
As this community grows, I have a duty to give back to all of you that helped me and supported me to become what I am. This free newsletter is just another way to share my experiences and prepare you for the journey that’s ahead of you.
Love,
Blood
Fundamental overview
It’s been a bit of a rocky ride in terms of the macro picture this past week. The threat of more aggressive rate hikes, which I mentioned in previous newsletters, is now becoming more apparent, with US stocks tumbling towards the end of the week. The S&P 500 and the Nasdaq index both bled out quite a bit, but the most interesting story in equities was what happened to Netflix. Showing that rugpull-level price action isn’t limited to altcoins with dodgy smart contracts, NFLX gapped down 30% last week, and it’s now 70% down from its November high.
Of course, this is a bit of an extreme example, and it had a lot to do with the service losing subscribers, but the fact that the Fed is getting hawkish with rates and unwinding its $9 trillion balance sheet certainly played a part. And, with equities behaving like they did, there are no prizes for guessing what happened to Bitcoin.
Bitcoin
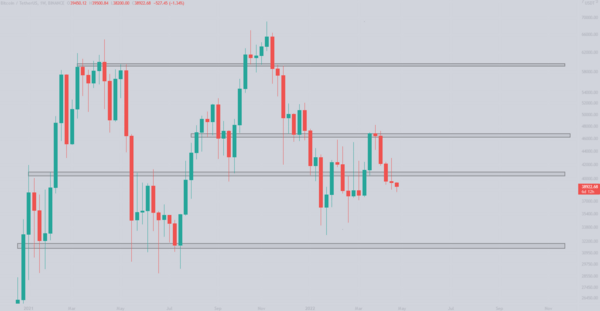
Bitcoin/Dollar Weekly chart
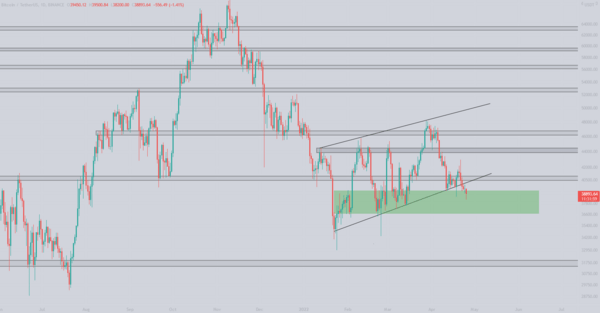
Bitcoin/Dollar Daily chart
Bitcoin loses the $40,000 level and trades in the 3D demand zone.
After reclaiming a major level the previous week and making a high of $43,000, which led most traders to believe we are going higher, we ended up getting a weekly close below 40k. At the time of writing, Bitcoin is trading at $38,434, which is a 3D demand zone (the green zone on the chart). We have discussed this demand zone a few weeks ago and back then it provided some good long entries. At the moment I am monitoring this zone as it would be a good level to bounce from, making a higher low.
Looking at the daily chart from the previous week, we can see that the trendline did not hold and we got a retest of it before going further down, indicating that it was confirmed as resistance. The only two levels that we can justify monitoring right now are the levels of previous wicks which are at $34,322 and $32,917. I am sticking to my plan and keeping my bids in the $30k-$32k range as those will be golden opportunities if we drop there.
Looking at the weekly level, the structure looks bearish as we got a second consecutive weekly close below $40k. Bulls tried to reclaim $40k, but got a nasty rejection and ended up retracing over 8%.
To sum up my trading plan, although I am very confident in the 3D demand zone I am not jumping to any conclusions here and I am closely monitoring these levels and keeping my low 30k bids in case things go south.
Ethereum
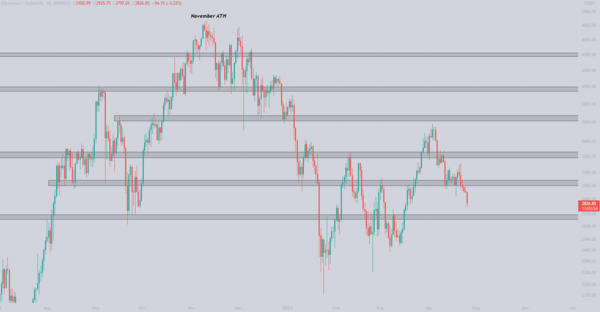
Ethereum/Dollar Daily chart
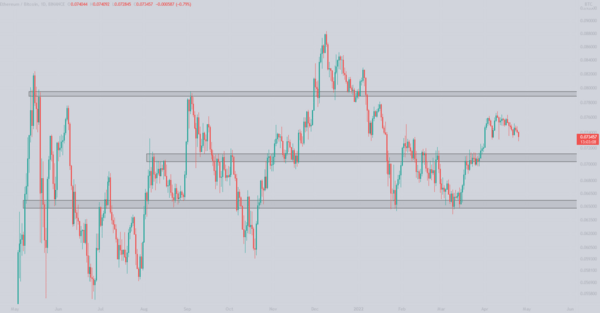
Ethereum/Bitcoin Daily chart
Ethereum loses the $3000 level and drops towards the next daily support at $2700.
Ethereum has been mostly following Bitcoin’s price action, except if you look at the ETH/BTC chart, which shows us that it’s slowly losing the battle. A downtrend that began in the beginning of April after making a high at 0.0758 is still ongoing and we are slowly approaching the key level at 0.071btc. Although ETH is currently showing weakness I am still confident it will outperform Bitcoin in 2022 due to its fundamentals. If the merge is successful I believe we could even see it outperform some of the competing layer 1s. I will talk more about this topic as the merge approaches.
Looking at the daily SR levels, bulls lost $3000 level meaning the next logical level here is $2700, which is also the level I am bidding at the moment. However keep in mind that if Bitcoin finds a bottom here in the 3D demand zone we might not see it reach that level, meaning I will buy more ETH after reclaiming the important $3000 level.
Blood’s content recap
Blood Trading League update
“27th April Beta Run of Blood Trading League™ will start.
5000$ Prize Pool for Top 100.
Winner will get invited to my Learn-Trade Party.
You don’t need real money, all for free on our Discord.
You can join to train, You can join to win”
Concluding notes
The question on everyone’s mind right now is whether the rate hikes have already been priced in and, if not, how long we’ve got until that happens. The problem with this question is that the current market environment – with inflation being where it is, along with the recent history of zero rates and incredible levels of stimulus and quantitative easing – is not exactly something that’s easy to compare with previous rate hikes and recessions.
In spite of the market reacting to the rate hikes now, we’ll have to see rates actually approach zero levels in real (inflation-adjusted) terms, in order to see how the market and the overleveraged world economy will react. One thing I’d add here is that you should be cautious of “too easy” reversals in US equities: with everyone conditioned to expect an extremely quick recovery along the lines of what happened in Q1 and Q2 2020, it might take significantly longer for bearish momentum to be exhausted. With that said, things aren’t necessarily that bleak with Bitcoin, as I don’t think we should take its current correlation with the tech sector as something permanent and unchangeable (not to say that it’s going away tomorrow either).

