


Bloodgang,
Welcome to the twenty-fifth issue of Bloodgood’s notes. The idea of this newsletter is to give you an overview of the previous week’s fundamentals and what happened on charts as well as to remind you of this week’s articles, secret TA tips, and trading calls. Basically, it’s about giving you all the key info in one place.
Table of contents
- Fundamental overview
- Bitcoin and Ethereum chart
- Blood’s content recap
- Concluding notes
As this community grows, I have a duty to give back to all of you that helped me and supported me to become what I am. This free newsletter is just another way to share my experiences and prepare you for the journey that’s ahead of you.
Love,
Blood
Fundamental overview
If you were expecting the market to give us some really clean price action across the board, rather than being driven by macro-level news in lockstep with equities, well, then you’d probably be somewhat disappointed. Even though the Fed was in blackout mode for the past 10 days, meaning that members of the FOMC (Federal Open Market Committee) weren’t allowed to speak publicly about policy, stocks still had a rough time, and Bitcoin was no different.
The main event that everyone is waiting for is the FOMC meeting this Wednesday, after which we’ll learn what the Fed decided. Most expect a half-point rate hike, so anything more than this would likely be very damaging to stocks, while a decision in line with market expectations could open the door to a relief rally in May.
Bitcoin
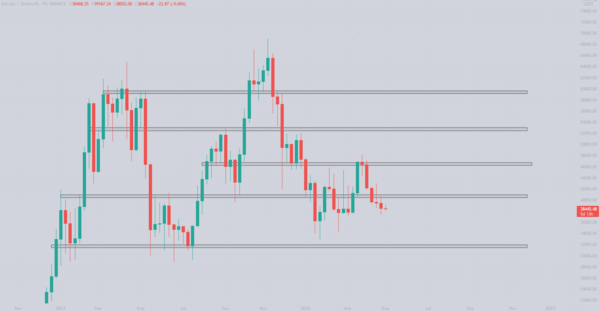
Bitcoin/Dollar Weekly chart
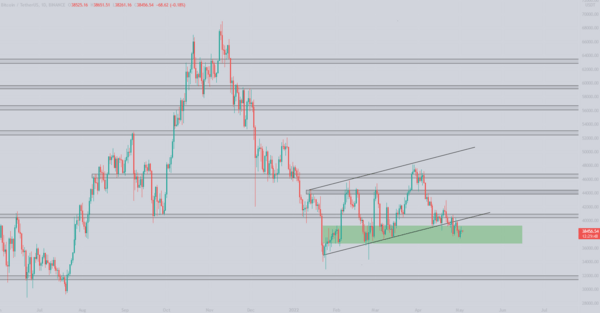
Bitcoin/Dollar Daily chart
Bitcoin downtrend continues, as the 3D demand zone holds.
Rough price action continues as Bitcoin seems glued to SPX and NASDAQ movements. Looking at the weekly Bitcoin chart, we can see that bulls tried to push above a key level at $40,500 but got rejected and the weekly candle closed around $38,500. This is the 5th consecutive red weekly candle close on Bitcoin, out of which 3 are below $40,000. I am expecting some kind of relief here in May and potentially a weekly green candle. We can’t go straight to zero right? …right??
The Bitcoin daily chart shows a clear rejection of the above mentioned level as well as a trendline breakdown which was retested resulting in a 7% drop. As mentioned in the title we are currently in the 3D demand zone where bulls seem to be stepping in and accumulating as the volume looks healthy.
Due to the current macro situation, I am not so confident in entering any new positions and due to tomorrow’s FED meeting I am expecting volatile price action. My suggestion is to stay on the sidelines until Thursday and wait for any key levels to be reclaimed before opening new positions.
Ethereum
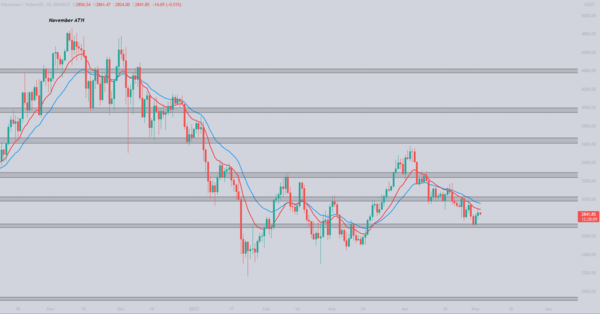
Ethereum/Dollar Daily chart
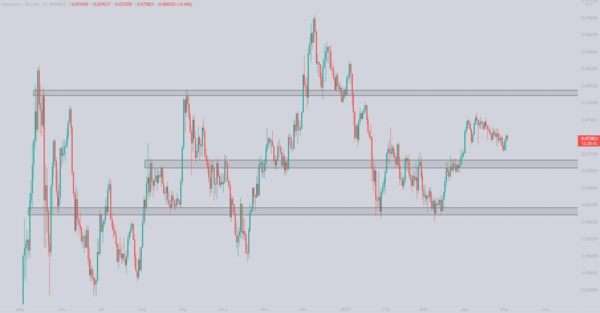
Ethereum/Bitcoin Daily chart
Ethereum in a clean downtrend, retesting key levels.
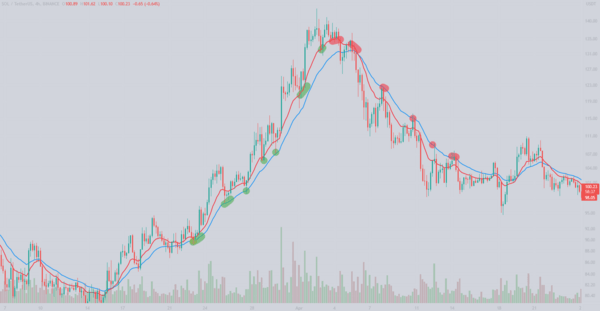
As seen from the ETH/USDT chart where I used the EMA 13 and 25, as described in one of my tweets, ETH has been moving in a clean downtrend, providing good short opportunities. Every EMA touch resulted in a profitable short, leading Ethereum to retest the $2700 zone where, as mentioned in previous newsletters, we placed our bids.
I am a bit skeptical about the recent PA and I am keeping my SL close to the entry as I prefer to wait for ETH to break above these short term EMAs which will result in a trend reversal. Similar to Bitcoin, ETH volume looks good, the fact that it’s not decreasing is a good sign.
On the ETH/BTC chart there are no big changes from the previous week, we are still kind of trading in between two key weekly levels, meaning that they are still really correlated. As mentioned in the previous letters I expect them to decouple as we get closer to the merge.
Blood’s content recap
Education tweet
“When you Scalp Range you must be careful about Failed Breakouts.
You either:
– Wait for fakeout and Open a short position after Clear Rejection of the breakout level
– Re-enter upon reclaiming the breakout level
Yes?”
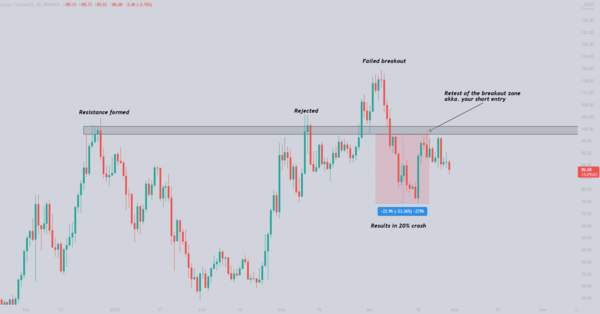
Breakouts and Fakeouts
Secret Trading tip
“Don’t overcomplicate things.
Use simple EMAs, I used EMA13 and 25 on the chart below, but other combinations work as well.
Long retests from above, short retests from below.
The more indicators you add, the easier it is to mess up.
Understood?”
Secret Trading tip
Blood Trading League
“Blood Trading League testing is live
A trading environment where you get to trade, learn and compete with others
There’s a monthly $5000 prize pool for top 100 on the leaderboard
And yes, it’s free, all I ask you is to share with ur frens“
https://discord.com/invite/bloodgang
Concluding notes
If your edge is in analyzing macroeconomic sentiment and trading choppy markets, you’re probably having a good time right now. If not, you might be on the brink of despair, but here you should keep in mind that markets won’t keep moving like this forever. In a sense, periods like these are useful in that they help crypto-native traders realize the complexity of the global economic situation. When things get real with major shifts in monetary policy, while recession and stagflation are the new trending topics, it’s not enough to simply trade the way you were used to during the most euphoric phases of the bull market.
But, again, these market conditions will change; we’ve already been in this crabby territory for some time now, and it’s a matter of time before the Fed decides it’s crashed equities enough. Especially now, with some notable tech stocks revisiting their 2020 lows, we could be in for a decent relief bounce.

