


Bloodgang,
Welcome to the twenty-sixth issue of Bloodgood’s notes. The idea of this newsletter is to give you an overview of the previous week’s fundamentals and what happened on charts as well as to remind you of this week’s articles, secret TA tips, and trading calls. Basically, it’s about giving you all the key info in one place.
Table of contents
- Fundamental overview
- Bitcoin and Ethereum chart
- Blood’s content recap
- Concluding notes
As this community grows, I have a duty to give back to all of you that helped me and supported me to become what I am. This free newsletter is just another way to share my experiences and prepare you for the journey that’s ahead of you.
Love,
Blood
Fundamental overview
The long-awaited Fed meeting last week brought the biggest interest rate hike since 2000, at 50 basis points (0.5%). This was in line with expectations, however, and the market was relieved that the Fed stated it doesn’t have any 75 basis point hikes planned. At first, everything looked like a decent relief bounce is coming, with stocks soaring on Wednesday, only to give back everything – and then some – on Thursday.
By now, it’s probably clear what this means for market sentiment – let’s just say it’s not too bullish right now, and this is only intensified for crypto. Stocks will likely bleed some more over the coming days and weeks, but the quicker they do that, the sooner the Fed will have no choice but to flip dovish and ease up on policy.
Bitcoin
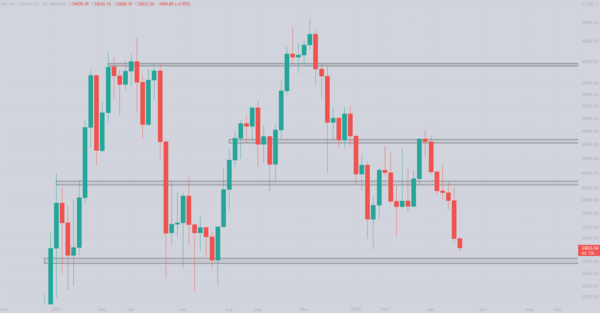
Bitcoin/Dollar Weekly chart
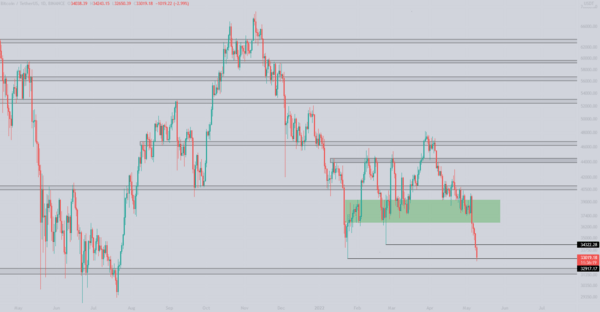
Bitcoin/Dollar Daily chart
Bitcoin loses the 3D demand zone and makes a new local low.
At the time of writing, Bitcoin just made a new low at $32,650 indicating that it could plunge towards the $30k area. If you have been reading my letters you know that this is the zone where I placed my bids a long time ago and I am confident they will be filled. After a strong rejection at the $39,500-$40,500 resistance zone, we have dropped 17%, ignoring all levels of support. Market is showing a lot of weakness hence i did not place any long bids on the mentioned levels. At this point all my bids are on spot and I tend to keep it that way until we see some strength. This kind of market is favorable for shorters and if you have been following my channel I posted a few examples of how you can use simple EMAs to nail short entries on alts.
Looking at the weekly level, Bitcoin has closed a 6th consecutive weekly red candle, with this one being the largest with a 15.8% change. I don’t remember when was the last time we had so many consecutive red weekly candles, even in the 2018 bear market this did not happen, which means that I am confident we will see some relief in May. Besides, the fear and greed indicator is at 11, and this is when most investors are looking to enter. Structure wise, we are hovering over the key support level where I expect bulls to step in and defend this level strongly. Upon losing the $28,400-$30,500 level we are looking to go towards $20,000. Looking to the upside, the first reasonable target on the weekly timeframe is $40,000 so this could be a golden opportunity for swing traders.
Ethereum
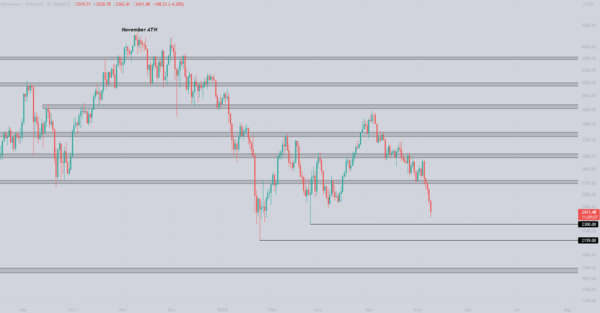
Ethereum/Dollar Daily Chart
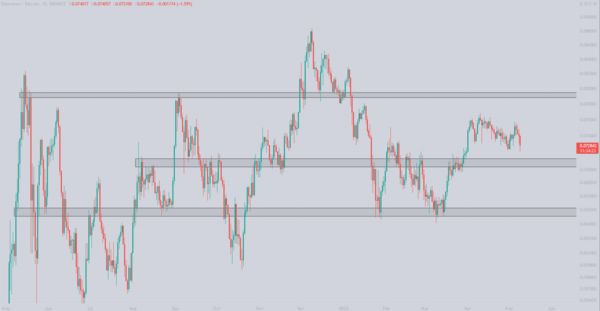
Ethereum/Bitcoin Daily Chart
Ethereum loses $2700 and plunges towards the low.
As discussed in the previous newsletter, Ethereum has been performing way better than Bitcoin in this 2022 downtrend. Structure-wise, ETH did not break January lows yet and it has not approached the weekly support level yet. Although by looking at the ETH/BTC chart we can see that in recent weeks that was not true. The important level as mentioned is 0.07-0.071 which should be monitored.
Similar to the plan I had for Bitcoin, I will keep monitoring the two wicks on Ethereum. First one being at $2300 and the second one $2159. This does not necessarily mean that I will max long at those levels, but if a bounce is seen on lower time frames, we could see that as a long position trigger.
My point being, do not rush in any new positions until the market shows any strength. If you want to test your strategies feel free to join my free learning environment in Discord where you can play with demo money.
Blood’s content recap
Blood Trading League
“Blood Trading league is on fire.
Test your strategies with demo funds, learn how to survive in a choppy environment, and compete with the rest of the blood fam.
You can still join the test round and get a chance to win a ticket to my party to discuss crypto & more.
Join here”
https://discord.com/invite/bloodgang
Bloodgood book
“If you know how to read charts, you know where and when the best Opportunity for buying is.
Opened 10 different charts, saw 4 opportunities for placing bids.
Copied section from my book will explain it better.”
Concluding notes
For now, it seems like playing scalp shorts can be a profitable strategy – just watch for lower (up to 4H) time frame retests of important levels or MAs, but always be careful when stocks are about to open. Any kind of relief in equities will likely translate into a quick bounce on Bitcoin, so keep your risk tight and your holding time short in this kind of a market.
That being said, I don’t think it’s impossible for Bitcoin to bottom out sooner than stocks do – not extremely likely, but definitely not impossible. Even if this does not happen, however, keep in mind that Bitcoin is in any case likely to bounce way, way higher than equities, and the 2020 Covid crash is a good example of this. At that point, the upside becomes ridiculously huge, so you better be ready to take advantage of it.

