


Bloodgang,
Welcome to the twenty-seventh issue of Bloodgood’s notes. The idea of this newsletter is to give you an overview of the previous week’s fundamentals and what happened on charts as well as to remind you of this week’s articles, secret TA tips, and trading calls. Basically, it’s about giving you all the key info in one place.
Table of contents
- Fundamental overview
- Bitcoin and Ethereum chart
- Blood’s content recap
- Concluding notes
As this community grows, I have a duty to give back to all of you that helped me and supported me to become what I am. This free newsletter is just another way to share my experiences and prepare you for the journey that’s ahead of you.
Love,
Blood
Fundamental overview
After a wild week in both equities and crypto, US stocks managed to climb on Friday, but not enough to recover last week’s losses. So far, more than $10 trillion in value has been wiped out from US stocks, and the fear (driven by increased likelihood of more hawkish Fed policy) isn’t going away just yet.
By far the biggest thing that happened, though, was the UST depegging event and the LUNA crash. After first showing signs of weakness on May 7, UST started to fall rapidly from its $1 peg last Monday, reaching as low as 5 cents. LUNA’s crash was far more spectacular, falling from above $60 early last week to $0.000001, as trillions of new coins were minted to try and restore the peg. This also played a significant role in Bitcoin’s dump, since the Luna Foundation Guard was forced to sell almost all of its BTC reserves to try and prop up UST.
Bitcoin
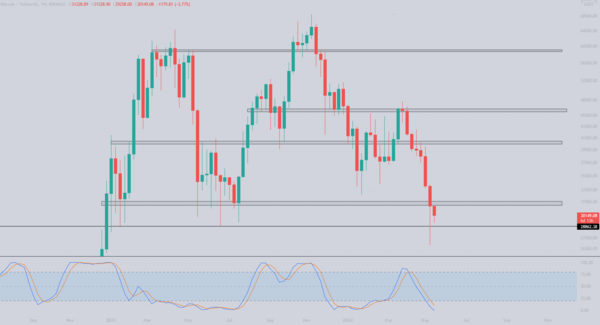
Bitcoin/Dollar Weekly chart
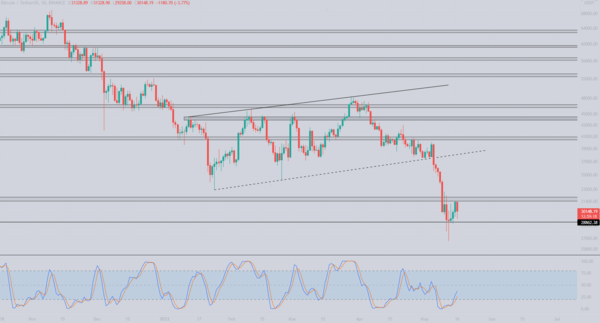
Bitcoin/Dollar Daily chart
Bitcoin prints a 22% weekly candle, bottoming at $26700.
After quite an eventful week in crypto, Bitcoin prints the 7th consecutive red weekly candle, breaking the $30k level. The fear and greed indicator was bottoming at 9 making investors capitulate which resulted in a nasty wick, a lot of trapped late shorters and a strong bounce to the $31,000 region. I mentioned this in the last two newsletters but I have never seen so many red weekly candle closes and I am expecting a relief rally, which we did not get in the last 2 weeks.
Even though we bounced from the lows, we still got a weekly candle close below the important $32000 level which indicates further downside. However, I also marked a new level at $28,862 which was the bottom in late January 2021 and then again in june 2021, meaning until we get a weekly close below that level I am not jumping to any conclusions.
Looking at the daily level we can clearly see where the $32,000 level was broken and how bulls tried to reclaim that level, but failed multiple times, creating a new range between $28,862 and $32,000, with the exception of the capitulation wick. This new range means lots of new trading opportunities. Looking at the stoch RSI on the daily level, we can see that we have exited the oversold area which could result in another retest of the 32k level.
Ethereum
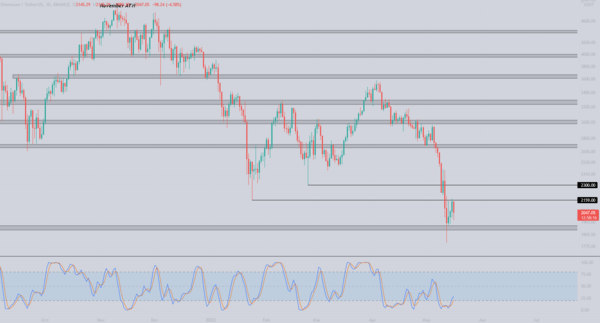
Ethereum/Dollar Daily chart
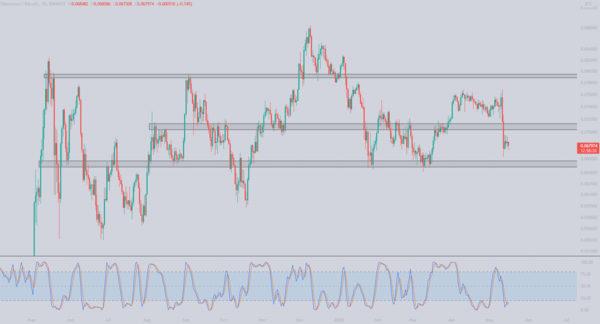
Ethereum/Bitcoin Daily chart
Ethereum performed better than bitcoin in the previous week, until it didn’t.
In the previous newsletters I have been talking about how Ethereum outperformed Bitcoin lately, I even saw some of the crypto twitter OGs selling their positions and buying ETH. However, there was a massive selloff on ETH which led to investors selling it for bitcoin, resulting in the loss of an important weekly level at 0.07 BTC. Now we are approaching the 0.065 level once again which bulls defended 2 times in 2022. Will they defend it again or are we revisiting the October 2021 lows?
We argued that structurally ETH/USD is in a better position than BTC/USD previous week, but we cannot say that anymore as the massive selloff caused ETH to drop by almost 30% in a week. The higher lows which I marked on the chart were not respected on the way down, however the low at $2159 acts as a strong resistance which was tested 3 times already. The first task for bulls is to clear these lows, and then we move onto the $2700 level. Similarly to BTC, stoch RSI is exiting the oversold area which could result in another test of the mentioned low.
Blood’s content recap
If you are still reading this newsletter, you are already a winer
“I know how many of you feel today.
My porfolio almost vanished in 2018. Was already blocfolio rich but didn’t took any profits so it wen’t all away.
Then I decided to take different kind of approach and made a fortune in following years.
It’s not over if you don’t give up”
New upcoming article
“Tough market conditions will wipe out most of the projects.
If you are new to the industry, the hardest part is understanding which projects will survive and which won’t.
I am preparing a step-by-step guide on how to do simple research in order to find projects worth investing”
Concluding notes
This should be a week to learn from: first and foremost, always make sure you know how the assets and protocols you’re investing in or using actually work. The death spiral was always a risk for LUNA and UST, but sadly, many people got into it with way too much relative size thinking it’s a risk-free way to earn 20% APY. Given how risk pricing and interest rates function, you shouldn’t be surprised to hear that there can never be such a thing as risk-free 20% APY.
Trading the LUNA crash was also incredibly difficult; it might look easy in retrospect, since you would’ve made 99.99% regardless of whether you shorted at $60 or $1, but on the other hand, when an insignificant dead cat bounce can be a 10x, shorting with size is basically Russian roulette. Overall, an important factor to consider is just how much US regulators disliked Luna and UST. If it’s true that a huge US fund caused the crash and profited from it (which we might never know for sure), I wouldn’t be surprised if all they got from regulators was a pat on the back, rather than the prison sentences that would happen if they did something similar with equities.

