


Bloodgang,
Welcome to the thirtieth issue of Bloodgood’s notes. The idea of this newsletter is to give you an overview of the previous week’s fundamentals and what happened on charts as well as to remind you of this week’s articles, secret TA tips, and trading calls. Basically, it’s about giving you all the key info in one place.
Table of contents
- Fundamental overview
- Bitcoin and Ethereum chart
- Blood’s content recap
- Concluding notes
As this community grows, I have a duty to give back to all of you that helped me and supported me to become what I am. This free newsletter is just another way to share my experiences and prepare you for the journey that’s ahead of you.
Love,
Blood
Fundamental overview
Even though Bitcoin (barely) managed to end its losing streak with a green weekly candle, the past week wasn’t that great for stocks, with the major indices closing in the red in spite of a decent rally on Thursday. The main cause of this is a stronger-than-expected US jobs report for May, which might well leave you scratching your head as to the reasoning behind this turn of events.
So why would a positive headline lead to a dump? Simply put, the labor market being stronger than expected means that the Fed will likely continue raising rates aggressively, as there’s more room to do so without wrecking the economy. In this kind of a market, where all eyes are on rate hikes and quantitative tightening, good news is bad news, and vice versa.
As one might expect, tech stocks were hit the hardest, because an increase in the cost of capital (which is what rate hikes essentially boil down to) hit riskier assets the hardest. With all this in mind, stocks aren’t looking too great, however this makes Bitcoin’s barely green weekly candle that much more important – but don’t get too optimistic just yet.
Bitcoin
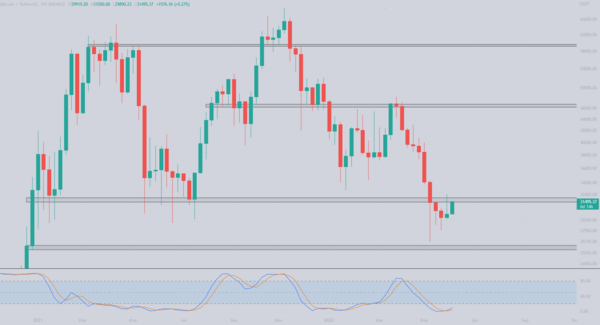
Bitcoin/Dollar Weekly chart
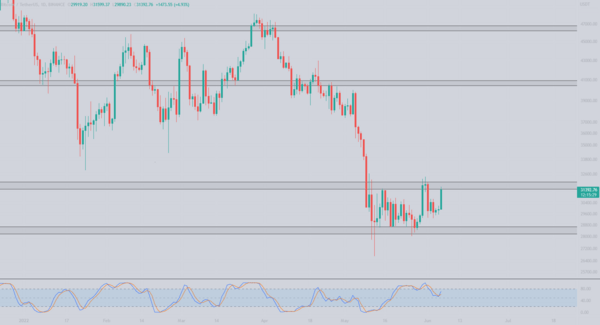
Bitcoin/Dollar Daily chart
High time frame Bitcoin chart still indicates further downside, with a slimmer of hope for upside.
After 9 consecutive red weekly candles we finally got the green weekly close. Overall, Bitcoin is still struggling to close above the $31,500-$32,000 level which could lead to a short-term reversal. At the time of writing, Bitcoin is sitting under resistance looking to reclaim a key level. Upon reclaiming it, we would be looking towards $37,000 and $40,000 as the next two levels.
The range is still respected on the daily timeframe. In fact, right after the previous newsletter we had a good short opportunity, as Bitcoin dropped over 8% a few days after. We are once again trading below the range high, which could present a good opportunity in case we get rejected again. I will closely monitor this level: in case we get a daily close above $32,000, I will consider this as an upside continuation signal.
In case Bitcoin is once again rejected at current levels, we are looking at two levels at $30,000 and $26,500. Looking at the Stochastic RSI, we can see that on the weekly level we are still in the oversold area which could give BTC further upside and on the daily level it bounced right off the midline, which also shows room to grow.
Time to break the resistance? As discussed in a twitter post late in May, I expect to see a stronger relief rally in June. In any case, we are in for an interesting week.
Ethereum
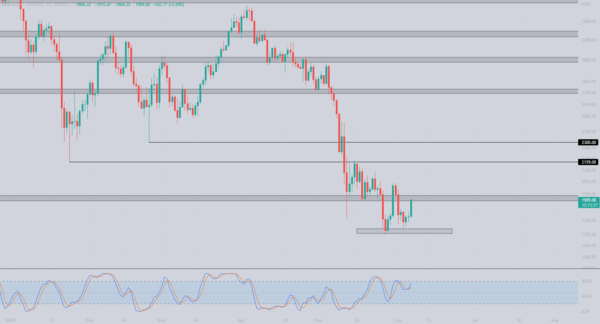
Ethereum/Dollar Daily chart
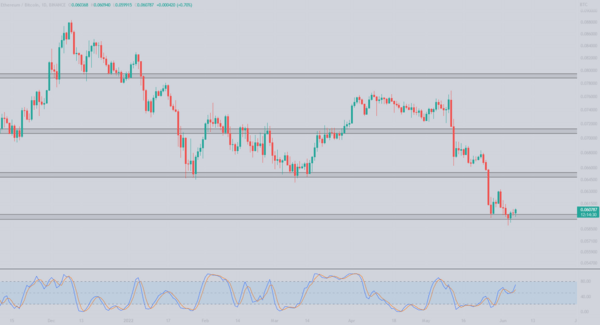
Ethereum/Bitcoin Daily chart
Ethereum barely holds support on the Bitcoin pair.
The ETH/BTC chart looks terrible and is hanging just above the support at 0.06 BTC. Upon losing this level, the next logical technical level lies at 0.057 and then a bit above 0.04 BTC. I was expecting the Ropsten testnet merge to positively impact Ether’s price and outperform BTC, but that isn’t the case for now.
The USDT pair looks a bit better although it’s approaching resistance (similar to Bitcoin’s price action). Looking at the daily level we can also see that a higher low was formed after making a local low at $1,700, and it’s important to mention that we also got a series of lower highs which are pushing ETH lower. My point being, do not take a higher low as a bullish signal until a higher high is confirmed.
An important thing to look at is the Stochastic RSI which made a lower high, while also being rejected at the 80 level. Looking at lower time frames (H4) we can see that bulls managed to reclaim the 100 MA, now let’s see if it holds as support as well. In case it is confirmed as support, we are looking at the H4 EMA200 at $2,090 as the target.
Blood’s content recap
Upgrading Bloodcast podcasts
“I am hiring a specialist with 12+ years of podcasting experience.
Every 2 weeks he will drop a podcast recapping what happened in the industry and discuss it with guests.
No matter how busy you are IRL, you will always be up to date, without even looking at PC.
No more excuses”
Concluding notes
Does the macro situation look bleak? Definitely. Could we see a countertrend rally take stocks and crypto higher in the coming weeks/months? Also definitely yes. One interesting thing to note is that the midterms (US elections) are coming in November, and the months leading up to it tend to be good for stocks. Simply put, crashing the economy is very bad marketing, and governments tend to do whatever they can to avoid it in the run-up to an election.
This factor makes countertrend rallies all that more likely, and it even opens the door to a somewhat longer reversal in US equities. However, it’s worth noting that runaway inflation is also extremely bad PR – most people tend to dislike not being able to afford basic necessities – so it’s not at all clear whether it’s possible to prop the market up without taking food and gas prices to the moon as well.

