


Bloodgang,
Welcome to the thirty-first issue of Bloodgood’s notes. The idea of this newsletter is to give you an overview of the previous week’s fundamentals and what happened on charts as well as to remind you of this week’s articles, secret TA tips, and trading calls. Basically, it’s about giving you all the key info in one place.
Table of contents
- Fundamental overview
- Bitcoin and Ethereum chart
- Blood’s content recap
- Concluding notes
As this community grows, I have a duty to give back to all of you that helped me and supported me to become what I am. This free newsletter is just another way to share my experiences and prepare you for the journey that’s ahead of you.
Love,
Blood
Fundamental overview
It seems that one catastrophic depeg event wasn’t enough for Q2; in the past few days, the price of stETH (Lido staked Ether) started to deviate significantly below its previous (roughly) 1 ETH level. This on its own isn’t that strange: stETH is simply a representation of Ether that is staked in the Ethereum 2.0 beacon chain, which means that it generates staking rewards, but it can’t be withdrawn from staking until after the merge to Proof-of-Stake (more precisely, probably until 6-12 months after the merge). Due to this lack of liquidity, it shouldn’t be surprising for it to trade at a significant discount to ETH, similarly to how Grayscale BTC trades at up to a 30% discount relative to BTC.
The reason this deviation is problematic is the systemic risk that it exposes: since stETH went live, many big players have started using leveraged strategies to borrow ETH against stETH, swap the ETH for more stETH, which they can then deposit as collateral and repeat the process. This leverages the yield generated by stETH, but it also introduces a new element of risk: if the price of stETH deviates significantly below the price of ETH, this could liquidate many very big entities in the space. So far, this process hasn’t started to spiral out of control, but it’s definitely something to keep an eye on, especially since Celsius is one of the entities that are exposed to stETH (and as of today, they closed withdrawals for users).
Meanwhile in the legacy markets, we’ve seen inflation hit new highs, with the US Consumer Price Index reading 8.6% for May, the highest level since 1981. Naturally, equities plummeted with fears of increased rate hikes and a more hawkish Fed causing panic. The next Fed meeting will be this week, so we’ll find out more about whether these fears will be realized on Wednesday.
Bitcoin
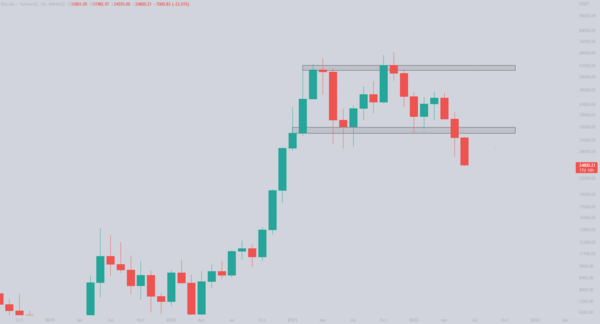
Bitcoin/Dollar Monthly chart
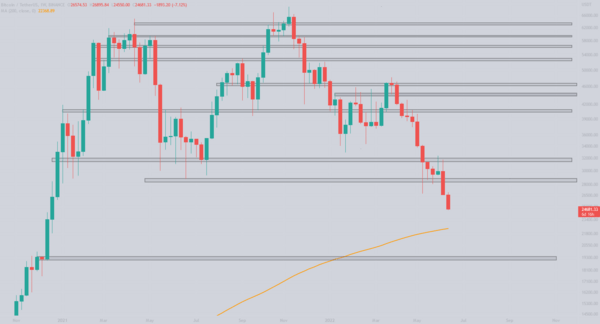
Bitcoin/Dollar Weekly chart
Bitcoin loses the $30k level and is down 25% since the local high at $32,300.
This was a tough day to wake up to and check the markets, as high inflation numbers will force the Fed to keep raising interest rates which will negatively impact risk-on assets. At the time of writing, Bitcoin is trading at around $23,800 and the monthly chart does not look promising at all. Unless a miracle happens, we have quite the space to fill, as there are no strong supports before the 2017 ATH and the $13k level.
Thank God there’s the weekly chart right?
After losing the $28,500 level, the next logical level in my opinion would be the weekly MA100 which lies just above the $22k level, and once again that would be a good spot to accumulate. Upon losing that level we could even see the previous ATH being reached. Of course, we never reached previous all time highs before, but who knows, we also did not think that we are getting 9 consecutive red weekly candles.
Ethereum
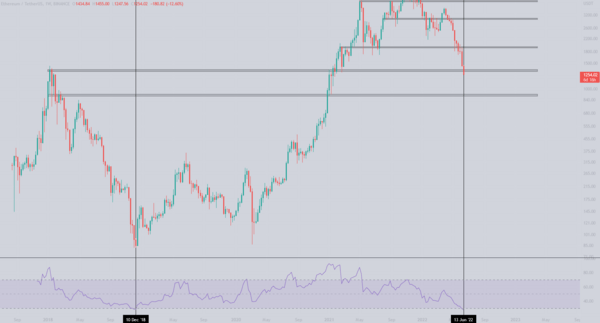
Ethereum/Dollar Weekly chart
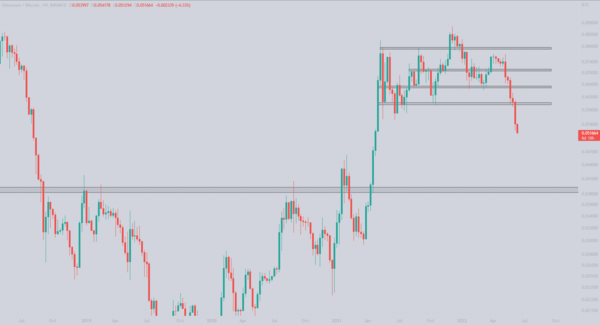
Ethereum/Bitcoin Weekly chart
Ethereum underperforms against Bitcoin and loses an important level.
Since the Celsius turmoil began, ETH has seen a lot of selling pressure which resulted in losing a key level against Bitcoin and the chart has a lot of downside potential. The next technical level that makes sense lies at 0.04 BTC.
At the time of writing Ethereum is trading at $1208, which means the USD pair is trading below its previous all time highs, however a bottom signal could be printed. As pointed out by Scott Melker on Twitter, the weekly RSI has dropped to the oversold area which was the bottom signal back in Dec 2018. Given that ETH has dumped way more than Bitcoin due to the whole Celsius fiasco, I am not so confident that this is the bottom, hence I have drawn the next technical level where it would make sense to accumulate more of the Vitalik coin.
However, for that level to be reached we would first need to get a weekly close below the 2018 ATH, so let’s not get ahead of ourselves and see how this week plays out. All eyes on the Wednesday Fed meeting.
Blood’s content recap
Bloodgood tip
“Many wonder what will make my book special
“Surely, it will be like any other crypto book”
You will invest 3-4 hours of your time for the experience I gathered throughout the years (6+ years).
Scrolling through feeds will not help you improve, investing time to read books will”
Concluding notes
If you’re surprised that so many things have crashed or been on the verge of crashing recently, then, well, maybe you shouldn’t be. Market conditions like these form the perfect environment for any systemic risk factors to come to the surface, whether it’s through leverage or flawed protocol design. It’s easy for any protocol to stay afloat in a euphoric bull market, with the constant supply of fresh liquidity making everyone look like a genius and every project like the best thing since sliced bread, but it’s times like these that separate the wheat from the chaff. Luckily, this is also the best time to build and learn: it might sound like a cliché, but times of gloom and doom are exactly when insane bull market profits are made. If you use this time to grow, you’ll be light years ahead of everyone that’s just entering the space (and trust me, that will be a huge number of people) the next time that Bitcoin is soaring to new ATHs.

