


Bloodgang,
Welcome to the thirty-second issue of Bloodgood’s notes. The idea of this newsletter is to give you an overview of the previous week’s fundamentals and what happened on charts as well as to remind you of this week’s articles, secret TA tips, and trading calls. Basically, it’s about giving you all the key info in one place.
Table of contents
- Fundamental overview
- Bitcoin and Ethereum chart
- Blood’s content recap
- Concluding notes
As this community grows, I have a duty to give back to all of you that helped me and supported me to become what I am. This free newsletter is just another way to share my experiences and prepare you for the journey that’s ahead of you.
Love,
Blood
Fundamental overview
On Wednesday, the Fed announced the most aggressive rate hike since 1994, increasing the interest rate by 75 basis points (0.75%). Interestingly, the reaction in equities wasn’t that bad, as it appears that the aggressive hike was priced in due to the CPI inflation data coming in higher than expected just five days before the Fed meeting. Prior to that, the consensus was that a 50 basis point hike would be the most likely decision, but the market was quick to pick up on the impact of these rapidly changing economic conditions. With US consumers feeling the impact of inflation more and more, this is a very political issue: the Fed needs to put on a tough act and at least give the impression that it’s fighting inflation head-on. Of course, the need to fund government spending or YCC (Yield Curve Control) will outweigh the downsides of inflation sooner or later and, when that happens, expect a very quick dovish pivot by the Fed.
Meanwhile in crypto, things are more chaotic: Celsius withdrawals are still closed, and recently a lot of rumors have started going around about Three Arrows Capital becoming insolvent. Nothing is completely certain just yet, but it seems there’s a lot of deleveraging that will have to happen very soon. If the 3AC rumors turn out to be true – given that it’s one of the biggest funds in the space with billions and billions of dollars in assets – the contagion could be massive. Until we learn what exactly is going on and who is affected, be extremely careful.
Bitcoin
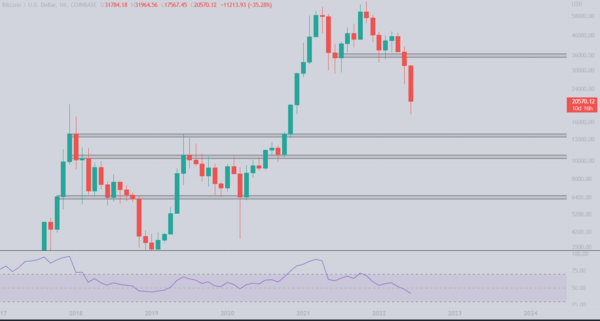
Bitcoin/Dollar Monthly chart
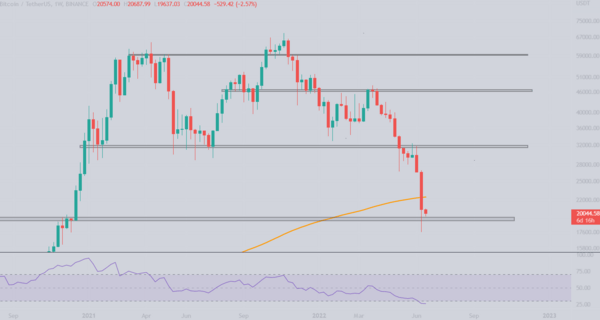
Bitcoin/Dollar Weekly chart
Bitcoin breaks previous all time highs and bounces over the weekend.
Tough week for all hodlers as Bitcoin drops to levels which most traders thought were impossible in this cycle. On the weekly level, we got a candle close below the weekly 200 MA, which was the CT bull hopium. A close below does not mean anything yet and I am certain that we are seeing a retest of the MA200 in the upcoming week. Two things can happen, first, if Bitcoin gets rejected at the MA, that presents a good short opportunity as we are about to see lower levels. Second, if we break above the moving average and confirm it as support we could see a big green candle and $30k might be reached sooner than you think. So far the previous ATH has been defended and bulls will do everything in their power to continue doing so.
I added the Bitcoin monthly chart as well this time as I think it is more useful when placing your bids. I was accumulating during the previous week’s crash and I am looking to accumulate lower in case that happens. Monthly levels are clear, $13,500, $11,000 and $6,400 respectively. For the record, i don’t believe these levels will be reached, but in case they are, it’s a good idea to be ready to bid them.
Looking at the Stoch RSI, the weekly is still oversold which indicates that we could have a relief rally soon whereas the monthly does not give any useful info at this point.
Ethereum
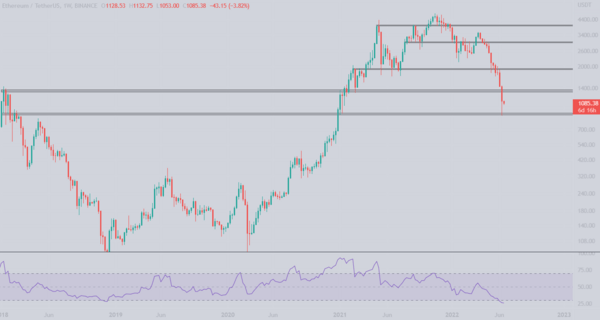
Ethereum/Dollar Weekly chart
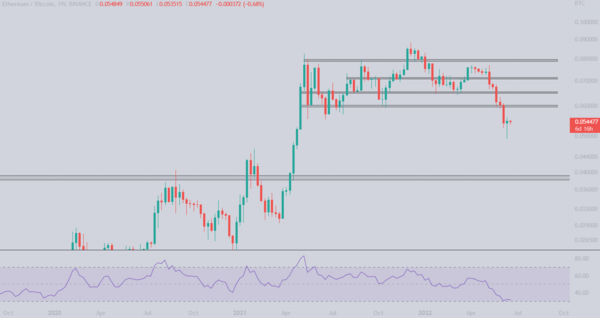
Ethereum/Bitcoin Weekly chart
Ethereum is down over 55% in a month, what is going on?
Due to the recent market conditions, many bigger players were forced to liquidate their positions, bringing loads of selling pressure on ETH. I am looking at two levels here on the weekly timeframe which could be the new range to trade. For now the $900-$950 level seems to be holding. As mentioned on Twitter, i also placed bids at $835 in case we get a capitulation wick to that level.
The weekly stoch RSI on the dollar pair remains oversold for the first time since 2018, whereas the daily level on the other hand tried to break out of the oversold area and got rejected.
After losing a key level, Ethereum is now keeping track of Bitcoin and ranging around the 0.055 BTC level. Looking at the higher time frame shows us 2 key technical levels. The first is the key level at 0.059 which was defended in May 2021 and the second is the 0.039 BTC level which I doubt we will see anytime soon. Due to the upcoming Ethereum merge, I expect the 0.059 resistance level to be tagged really soon.
To sum up, my plan is simple, monitor the two mentioned levels on the USD pair and try to play the range and at the same time, monitor the ETH/BTC resistance at 0.06 and derisk if weakness is seen.
Blood’s content recap
Crypto Trading Guide giveaway
Concluding notes
We’re living through some very chaotic times for crypto, but what does that mean for you? If you’re in it for the very long run, then yes, $20k does seem like a no-brainer. But if we look at the shorter-term outlook, it’s not at all that clear that these levels will be respected.
If you think I’m overreacting “just because one fund [allegedly] blew up,” then you might not be aware of how quickly risk spreads across a market as leveraged as crypto. Now, when we’re seeing tightening financial conditions across the board, having a fund with $18 billion dollars of assets under management potentially go underwater is pretty much the perfect storm for the whole market. A fund of that size has to be borrowing from many huge institutional players and, if that debt goes bad, so do the lenders. Hopefully this all gets resolved without Luna-style systemic contagion, but until the smoke clears, don’t get too exposed.

