


Bloodgang,
Welcome to the thirty-third issue of Bloodgood’s notes. The idea of this newsletter is to give you an overview of the previous week’s fundamentals and what happened on charts as well as to remind you of this week’s articles, secret TA tips, and trading calls. Basically, it’s about giving you all the key info in one place.
Table of contents
- Fundamental overview
- Bitcoin and Ethereum chart
- Blood’s content recap
- Concluding notes
As this community grows, I have a duty to give back to all of you that helped me and supported me to become what I am. This free newsletter is just another way to share my experiences and prepare you for the journey that’s ahead of you.
Love,
Blood
Fundamental overview
Over the past week, stocks showed quite a bit of strength, with the S&P 500 gaining over 3% on Friday, the best day for the index since May 2020. But why is that, isn’t everyone expecting a recession?
Basically, there are two ways of looking at what’s happening. The first one is simply that it’s a countertrend or “bear market rally,” which will fizzle out very quickly. The second is that the Fed’s hawkish policy has already been priced in, and that expectations of a recession and violent bear market are exaggerated. It’s obviously impossible to know whether future rate hikes have been priced in – simply because no one knows exactly how much they’re going to be – but I do lean in the direction of uncertainty: the more that consensus around a bear market becomes unshakeable, the more I’d be careful about taking it for granted.
In any case, it doesn’t look like Q3 is going to be great for stocks, but that doesn’t mean that we’ll see a clear and strong bearish trend. One possibility, and probably the one that trend-following swing traders would hate the most, would be an extended period of chop. The Fed’s current approach, which isn’t hawkish enough to tackle inflation quickly, looks like it favors just that.
Bitcoin
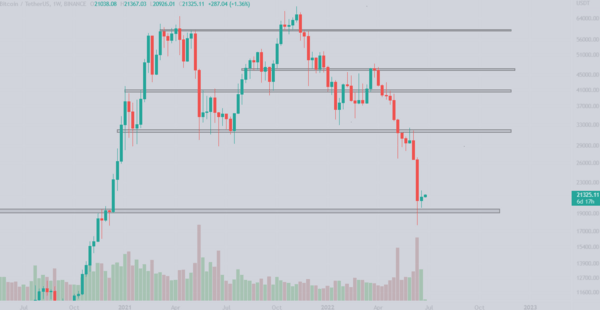
Bitcoin/Dollar Weekly chart
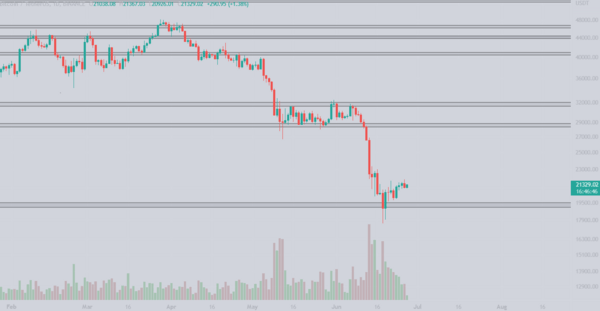
Bitcoin/Dollar Daily chart
Bitcoin all time highs defended.
Since last week when we discussed the previous all time highs being broken, we saw bulls enter aggressively and defend the level, which indicates that those levels are interesting for players to step in. To confirm that you can look at the daily Bitcoin chart where you can observe the volume. The wick below the support level which made a low at $17600 seems like a bear trap for now, but let’s not get ahead of ourselves and see what this week brings us.
The weekly candle has closed green which is a rare thing nowadays, however the weekly MA200 has not been tested yet. As discussed in the previous newsletter, if we are getting a bounce, this is my first area of resistance and if you bought the lows, this could be a good idea to derisk a bit. The daily stoch RSI is already in the overbought area which could indicate a small retrace before going further up. The weekly RSI hasn’t exited the oversold area, which is a good sign for the bulls as it shows further upside potential on the weekly level.
So far the ATH level on Bitcoin provided a good zone to accumulate, so this is my area to buy some right now, and if we are going lower, the monthly levels are clear: $13,500, $11,000 and $6,400. If we push above the MA200 I am looking at 2 CME gaps to be filled really fast. See the CME gaps levels below in the “content recap section”.
Ethereum
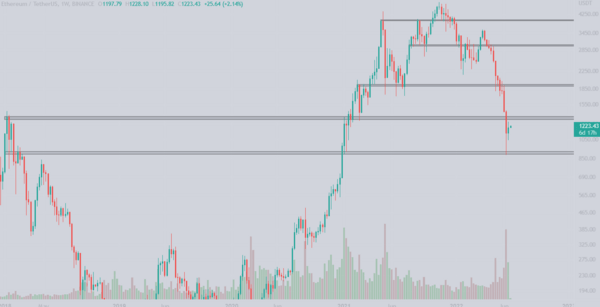
Ethereum/Dollar Weekly chart
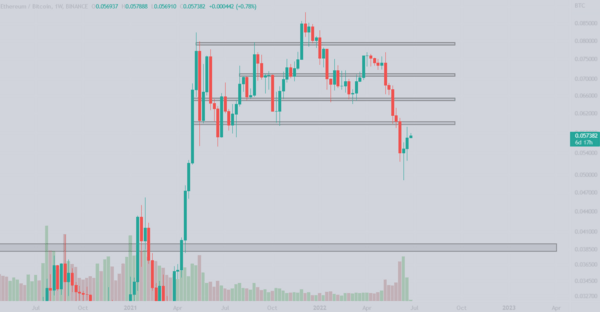
Ethereum/Bitcoin Weekly chart
Ethereum defends $900 and provides an over 40% bounce from the lows.
Ethereum has taken on a lot of selling pressure lately due the whole Celsius fiasco, however in anticipation of the merge coming, buyers seem to be stepping in aggressively which can also be seen in volume. The previous all time highs were almost tested last week however the sellers are obviously stepping in there as this is the first technical resistance that makes sense now. ETH has also broken above the MA200 weekly resistance and the weekly candle is trading above it already, however keep in mind that we have to wait for weekly close to confirm it as support.
The ETH/BTC chart pumped straight to a key level and got rejected (for now). Looking at the higher time frame shows us 2 key technical levels. The first is the key level at 0.059 which was defended in May 2021 and the second is at 0.039 BTC. We talked about these levels and came to a conclusion that 0.039 is not going to get reached so easily. Instead 0.059 was tagged last week and so far it was too hard to break. However, if you swapped some bitcoin for ETH 1 week ago, this would be a good place to take profits and re-enter after reclaiming the mentioned level.
Blood’s content recap
#Bitcoin macro trading
One of these CME gaps is getting filled by the first week of July.
TP 1 – $28000
TP 2 – $35000
Stops in place.
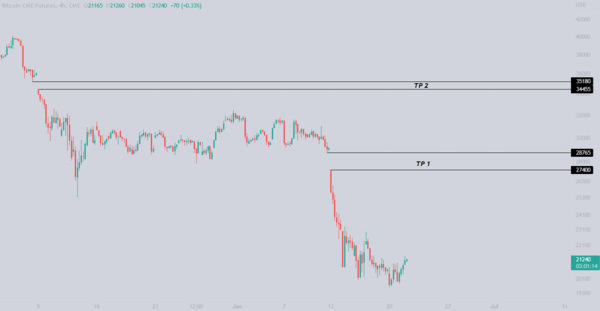
Cme gaps
Concluding notes
Many of the systemic risks and uncertainties within crypto that I mentioned in previous newsletters are still relevant. While some centralized lending and borrowing companies appear to be getting bailed out, it’s still far from clear just how far the fallout from Three Arrows Capital will spread.
Crypto uncertainty might not be the thing you want to see most on top of extreme macroeconomic uncertainty, but those are just the conditions we have to face right now. Even though it does look like most of the institutional puking is likely to be over when it comes to the companies that have been going insolvent, it’s definitely worth watching the bigger picture, especially Grayscale’s application to turn GBTC into an ETF. Any unexpected developments there could have a huge impact on the market, while having the process go to court would be less eventful, as that would lead to a long and drawn out legal battle.

