


Bloodgang,
Welcome to the thirty-eight issue of Bloodgood’s notes. The idea of this newsletter is to give you an overview of the previous week’s fundamentals and what happened on charts as well as to remind you of this week’s articles, secret TA tips, and trading calls. Basically, it’s about giving you all the key info in one place.
Table of contents
- Fundamental overview
- Bitcoin and Ethereum chart
- Blood’s content recap
- Concluding notes
As this community grows, I have a duty to give back to all of you that helped me and supported me to become what I am. This free newsletter is just another way to share my experiences and prepare you for the journey that’s ahead of you.
Love,
Blood
Fundamental overview
The Fed chose a 75 basis point rate hike last week; while this is exactly what most analysts were expecting, the effect it had on the market was much more positive than one would think. The reason behind this is the wording of their statement: apparently, the Fed thinks that inflation is well on its way to being under control, so that aggressive hikes might not be necessary from now on. Instead, they will take a more data-driven approach, which means that rate hikes will only be a response to future inflation, labor market and other economic data, rather than the default option.
Long story short, this means we’re heading for more “good news = bad news” sentiment when it comes to the strength of the economy: expect any unexpectedly good job reports to cause a dump, as that will enable the Fed to hike rates a bit more aggressively again. On the other hand, if such key economic data remain in line with (or slightly below) expectations, the market should react positively as the Fed’s dovish pivot seems more or less inevitable.
Bitcoin
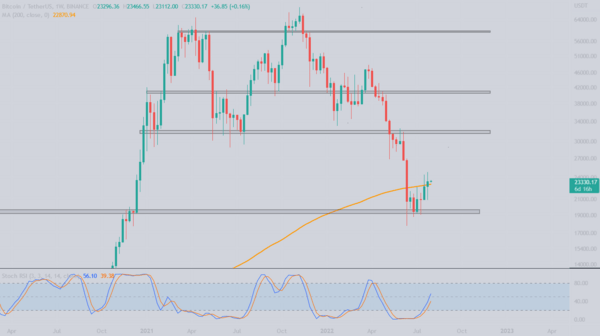
Bitcoin/Dollar Weekly chart
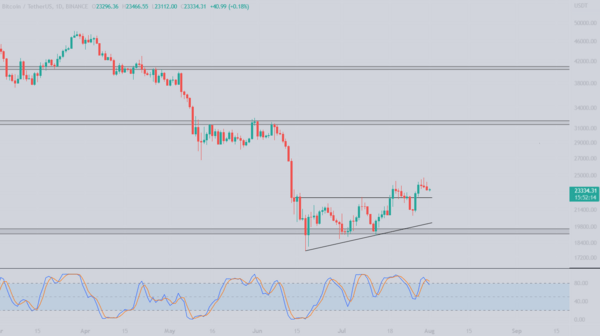
Bitcoin/Dollar Daily chart
Well, we finally got what we were waiting for.
The Bitcoin weekly candle closed above the MA200, so now what? Personally, I think most traders that were parked in stables will start entering at this point. Now the big question is, do we wait for a confirmation candle above the MA200 and wait for another weekly close above or are we going to be degens? It depends on your trading style: some prefer to be safe and wait in case this turns out to be a bull trap, but then again some are willing to risk it and enter as soon as possible. Time will tell who was right.
Looking at the daily chart, we can see that bulls managed to push out of the ascending triangle once again after a bullish hammer candle was printed on the daily timeframe. We discussed in the previous letter that the uptrend line would be a great entry but unfortunately our bids were not filled this time. The Stoch RSI is just about to exit the overbought area which could result in a small retrace but all eyes will be on the weekly MA200 and on the ascending triangle.
Ethereum
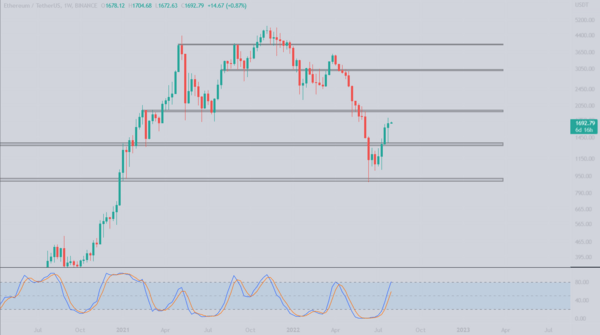
Ethereum/Dollar Weekly chart
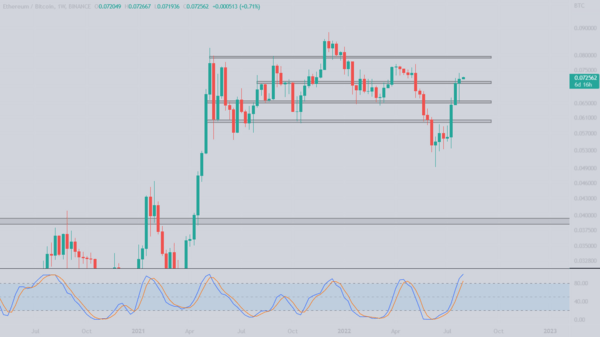
Ethereum/Bitcoin Weekly chart
Ethereum prints the 4th green weekly candle in a row.
Well, if our Bitcoin bids didn’t get filled, we surely managed to scoop some ETH. In the previous letter we discussed that the only logical technical level on the USD pair was the support zone around $1350. We got a golden opportunity when ETH made a low of $1356, got bought up fairly quickly, printed a hammer pattern on the daily timeframe and later on made a new high of $1784. A dream come true for day traders! The weekly timeframe is as bullish as it gets, but similarly to the previous week, this is not where you enter into a trade! We either wait for another potential drop into $1350-$1450 or wait for short opportunities around $2000.
Going over to the ETH/BTC chart we can see that bulls managed to break and close above an important level at 0.07 BTC. Many traders on CT were in disbelief after ETH pumped above this level and called for a rejection, but so far it’s been holding. The weekly Stoch RSI shows that we entered into the overbought area which could soon result in a retrace. The ideal situation that we would like to see is ETH pushing towards 0.08 BTC and only then retracing. Retracing now will result in a failed breakout and a retest of the 0.065 BTC level.
Blood’s content recap
“Blood Trading League is back!
BTL is a free trading environment where you can trade, learn, hang out with frens and earn real money
Starting this Wednesday in my Discord
There will be rewards for best traders, I will give out 25 BG books and $1000 in trading capital
Ready?”
How not to get fucked by Gov. part 1
“Started Crypto to Cash and vice versa business a while ago.
Crypto->cash fee is around 5%.
Opened a LTD & made an invoice to an enterepreneur for company funds->cash for a 10% fee.
Crypto gains-> property buying with 0% expenses.
Want more of that alpha taxooor tweets?”
Telegram explanation post
Further explanation on how not to get f*cked by the Government.
https://t.me/bloodgoodBTC/1079
Concluding notes
While the Fed pivot—along with the prospect of buying EU and Japanese bonds that I mentioned in the previous newsletter—might be exciting, you should still keep in mind that the broader macroeconomic environment is not exactly ideal. In fact, last week the US announced it just had the second consecutive quarter of negative GDP growth. Normally, this would constitute a recession, but—worry not—the White House managed to save the day by… changing the definition of a recession!
So, yeah, things aren’t exactly going great. That’s not to say that risk-on assets will necessarily suffer: if the Fed narratives mentioned above do play out, then expect nothing less than a face-melting rally. That’s still an important if to keep in mind—and at the end of the day, it’s being able to take these ifs into consideration that separates traders from gamblers.

