


Bloodgang,
Welcome to the forty-second issue of Bloodgood’s notes. The idea of this newsletter is to give you an overview of the previous week’s fundamentals and what happened on charts as well as to remind you of this week’s articles, secret TA tips, and trading calls. Basically, it’s about giving you all the key info in one place.
Table of contents
- Fundamental overview
- Bitcoin and Ethereum chart
- Blood’s content recap
- Concluding notes
As this community grows, I have a duty to give back to all of you that helped me and supported me to become what I am. This free newsletter is just another way to share my experiences and prepare you for the journey that’s ahead of you.
Love,
Blood
Fundamental overview
The long-awaited Powell speech on Friday was all the talk in the markets as the Fed chair single-handedly wiped $78 billion of wealth from the richest Americans in just eight minutes by causing stocks to plummet. While he didn’t say anything substantially new—like I said in the previous newsletter, many were premature in their expectations of the Fed pivot—he did make inflation the main talking point, and this was apparently enough to cause the ensuing dump.
What now? Well, the US open is likely to be ugly, as stocks in the EU have already gapped down, and there’s no reason to believe that the US will be any different. However, that brings something else to the table: the well-known dynamic of the Turnaround Tuesday. In case you haven’t heard about this, it’s basically a fairly reliable pattern in the stock market: as everything sells off and then gaps lower on Monday, shorts get too aggressive and push the price even lower by the time the markets close. But then, on Tuesday, the shorts get squeezed and stocks rip back up. I’ve seen a lot of people mentioning this pattern, but keep in mind that this time things are a bit different, as the sell-off had a very clear trigger on Friday (rather than simply continuing a dump that started earlier in the week).
Bitcoin
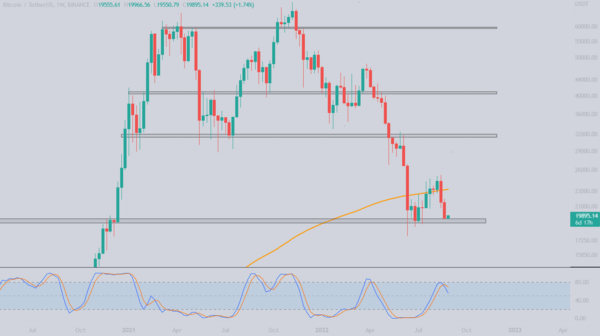
| Bitcoin/Dollar Weekly chart |
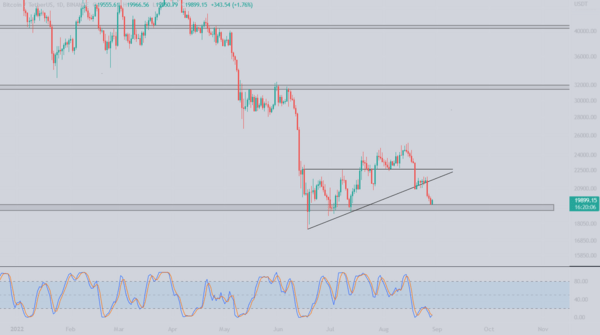
| Bitcoin/Dollar Daily chart |
Bitcoin plunges after Powell says Fed will focus on fighting inflation rather than economic growth.
We discussed these levels in the previous letter, $19k was the next weekly technical level in case we lost the ascending triangle formation on the daily. No wonder that after the Powell speech on Friday we started plunging towards that level and closing the weekly candle around $19,500. Bulls are stepping in since this is a good level to accumulate but the question is now, will the level hold? Anyway, we are sticking to our plan and had our bids placed at this level, so let’s see how it plays out.
On the daily we can see how nicely the support line of the triangle held up until Friday. Looking at the stoch RSI, we can also see that it wanted to push out of the oversold area, however the crash towards $20,000 rejected it and we plunged back lower. September is historically a bearish month without anything interesting happening, but I have a feeling this year will be different due to the upcoming events.
Ethereum
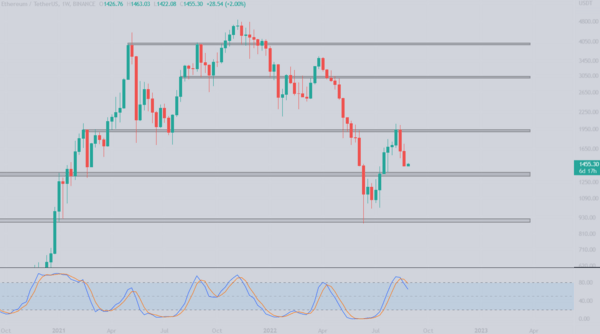
| Ethereum/Dollar Weekly chart |
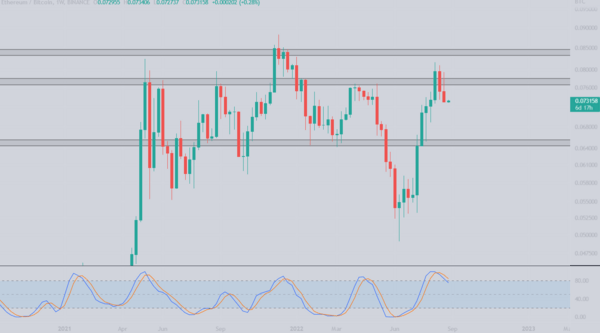
| Ethereum/Bitcoin Weekly chart |
Ethereum follows our plan perfectly.
Another proof that during tough market conditions we should stick to high time frame charts and be patient. Upon the $1900-$2000 rejection we were waiting for the $1350 zone, which we are pretty close to now. None of my bids were filled yet, but we can start slowly DCAing at current levels, all the way to $1350 with a stop loss right below the level. We have about 2 weeks to the Merge and the closer we get, the more attention there will be on Ethereum. Although we will have to wait and see whether that’s good or not, I do expect some volatility around it.
The ETH/BTC chart shows a clear rejection at 0.077 BTC, which means that we could drop to the 0.066 BTC level again, but since we are closing in on the Merge I don’t expect that to happen, but I will monitor 0.077 BTC to see the reaction upon testing it.
Blood’s content recap
A reminder.
“Thinking that traders know smth that you dont is a stupid excuse.
Here is what you’ll do
1. Choose 2 coins, Eg. $SOL, $FTM
2. Use EMA,MA & draw SR
3. Monitor PA for 2 weeks w/o taking a trade
DM me after 2 weeks if you dont get it. You dont need Talent, invest your free time.”
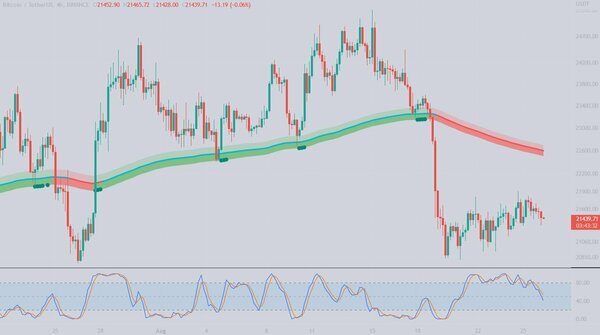
Swing Trading Exercise using BloodSwing Indicator
“Learn swing trading with BloodSwing Indicator
– If EMA turns Green you look for Longs upon touch
– If EMA turns Red you look for Shorts upon touch
Don’t force trades, trade when price enters the zone around EMA
Works best on #Bitcoin H4 chart. Sharing link in my Telegram.”
Concluding notes
It’s difficult to trade a market with so many complex factors that could influence it being mentioned every single day. But then again, just keep in mind that most of them—whether it’s the war in Ukraine or student debt cancellation—boil down to one thing: USD liquidity conditions. When the Fed starts pumping more money into the economy, markets will rally. Note that it’s when, not if. Of course, it’s not like the Fed has anything substantial to do with Bitcoin and crypto per se, but it’s simply a fact of life that this is the kind of market we’re in now, so we might as well play along with it.

