


Bloodgang,
Welcome to the forty-third issue of Bloodgood’s notes. The idea of this newsletter is to give you an overview of the previous week’s fundamentals and what happened on charts as well as to remind you of this week’s articles, secret TA tips, and trading calls. Basically, it’s about giving you all the key info in one place.
Table of contents
- Fundamental overview
- Bitcoin and Ethereum chart
- Blood’s content recap
- Concluding notes
As this community grows, I have a duty to give back to all of you that helped me and supported me to become what I am. This free newsletter is just another way to share my experiences and prepare you for the journey that’s ahead of you.
Love,
Blood
Fundamental overview
The macro outlook is starting to look extremely interesting – but not in a good way. A new week brings a new low in EUR/USD, while there are more and more protests starting across the EU because of energy costs. And the most important part? It’s barely even September. What happens when households actually start to need heating?
To add insult to injury, Russia decided to ‘indefinitely’ suspend natural gas flows through the Nord Stream 1 pipeline, supposedly due to a technical fault, but most likely as a response to a plan by G7 countries to impose a price cap on Russia’s oil exports. Russia’s reasoning is simple: Don’t want to pay market price for gas? Fine, hfsc (have fun staying cold).
What all this means for the global markets is far from clear, but it sure doesn’t look good for European equities. As for crypto, it could go both ways, especially since inflation could easily rip higher in the Eurozone.If the US decides to step in and buy their bonds, then we have all the makings of an insane liquidity injection.
Bitcoin
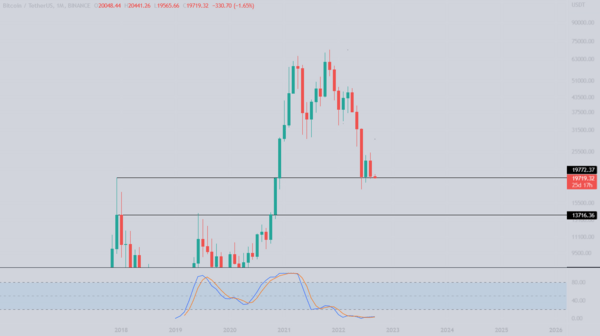
Bitcoin/Dollar Monthly chart
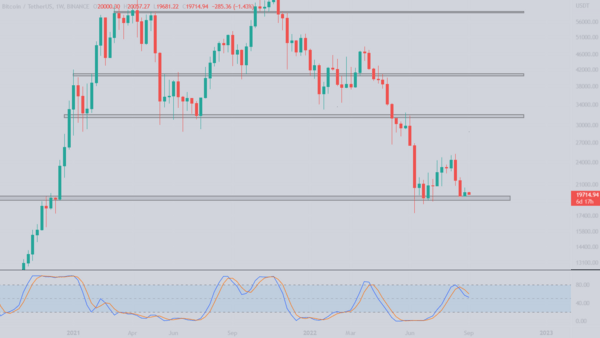
Bitcoin Dollar Weekly chart
Bitcoin barely holds the crucial monthly level.
It’s been quite a boring week in technical terms, as Bitcoin traded near support most of the time, moving 5% from the open, only to retrace by the end of the week. September has only just begun and we have one of the biggest crypto events in Ethereum’s history coming up, which makes me believe that some upside will be seen.
Currently, we are trading at 2017 ATH levels, which seems to be a strong support for both the weekly and monthly timeframe. Since the crash in June, no monthly candle has closed below this level, indicating this could indeed be a good buy. Moreover, looking at the weekly structure, we could be forming a Wyckoff accumulation pattern. Anyway, in case of a breakdown on the monthly timeframe, I will be bidding the $13,700 level as that is the only level that would make sense to me.
The weekly RSI was rejected at the 80 level and has approached the midline where we could see a bounce. Stoch breaking lower could indicate we are losing the 2017 ATH level.
Ethereum
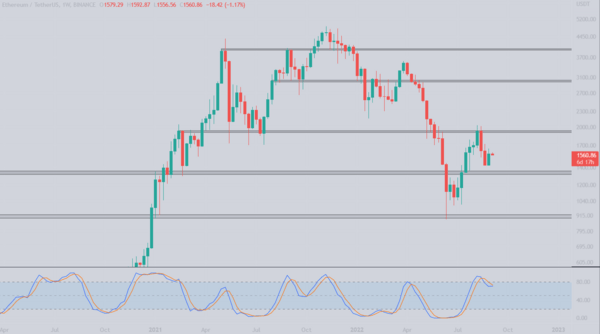
Ethereum/Dollar Weekly chart
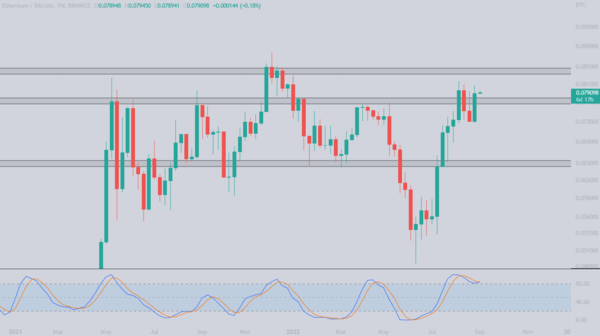
Ethereum/Bitcoin Weekly chart
Ethereum reclaims 0.077 BTC, eyeing merge in 10 days.
As discussed the previous week, after losing the above mentioned level, it was highly unlikely ETH would drop further down as one of the biggest events in crypto is about to happen. In my opinion the event itself is already somewhat priced in and it’s hard to predict what will happen as the event gets closer. Will this be a “sell the news” type of event or will Eth pump if the merge is successful? Anyway, I strongly suggest not trading the event itself as it could liquidate you pretty quickly. I will avoid trading around the news, as I got burnt on quite a few events already. The USD pair has pushed towards the midline of this $1350-$1900 range, leaving our bids behind. No worries, we are leaving our bids there in case we get another retest. Entering now in a new swing position is a formula to get liquidated.Stoch RSI has just left the overbought area which indicates a short retrace could be seen before going further.
Blood’s content recap
Bear Market Guide
“How to trade in Bear market part 1
- Go to CMC or CoinGecko
- Choose top 30 coins
- Chart S/R on Weekly & Daily
- Identify trendlines
- Use EMA 200, 15, 25 & 30 and MA100
- Set alarms
Don’t force trades on lower timeframes.
Monitor the chosen charts once a day and be patient.”
New exercise
“Risk management exercise
- Decide the total trading capital (Eg. $1000)
- Search for trades with BloodSwing indicator
- Enter trade with 5% of the total capital
With this exercise you will learn how to remove FEAR from your trading decisions
DM the results after 10 trades”
Concluding notes
Why is the macro situation so ambiguous for crypto? Well, on the one hand, a global crisis with social unrest in the Eurozone would send shockwaves throughout every single market, and if the EU starts having serious stability issues, that would be really bad. However, there are two potential scenarios that would be extremely bullish for crypto.
First, the US could step in by buying European bonds to keep them afloat. This would inject a lot of liquidity into the market, and it makes sense that the US would choose to do this (after all, they’re the ones with the biggest interest in gas flows from Russia staying shut off). Second, even if we do see unrest spread somewhat, is it really impossible for people to start considering Bitcoin as an alternative to the failing fiat system?

