


Bloodgang,
Welcome to the fifty-seventh issue of Bloodgood’s notes. The idea of this newsletter is to give you an overview of the previous week’s fundamentals and what happened on charts as well as to remind you of this week’s articles, secret TA tips, and trading calls. Basically, it’s about giving you all the key info in one place.
Table of contents
- Fundamental overview
- Bitcoin and Ethereum chart
- Blood’s content recap
- Concluding notes
As this community grows, I have a duty to give back to all of you that helped me and supported me to become what I am. This free newsletter is just another way to share my experiences and prepare you for the journey that’s ahead of you.
Love,
Blood
Fundamental overview
After a period of classic bear market sideways price action on the lower time frames—with longs and shorts getting chopped up left and right without a clear trend in sight—we’ve got quite the exciting week coming up in terms of impactful events. CPI numbers are coming out tomorrow, with the forecast being 0.3% MoM and 7.3% YoY for headline inflation. We’ve all seen the Fed’s renewed hawkish enthusiasm, so higher inflation could easily lead to a higher than expected hike, as the FOMC meeting is right after the CPI release, with the crucial rate hike decision set to be announced on Wednesday. Moving to the other side of the pond, both the BoE (Bank of England) and the ECB (European Central Bank) will release their own interest rate decisions on Thursday, meaning that we will have a very news-driven week. If you’re interested in EUR/USD, keep in mind that temperatures are starting to drop and electricity might moon again, putting more downward pressure on this pair (similarly to what I talked about in previous newsletters, when EUR/USD was reaching parity after a long time).
Finally, SBF will testify before the House Financial Services Committee tomorrow and, understandably, everyone is keen to hear what he’ll say. I don’t think this will be much of an event, though, as he’ll probably just keep repeating the same pathetic excuses that he has been giving in every interview since the collapse. Also, given how many friends he has there (and how clueless most are about crypto), I don’t think anyone will really probe his answers enough to get anything interesting out of him. The interesting bits will only happen at his trial, but that could be years away at this point.
Bitcoin
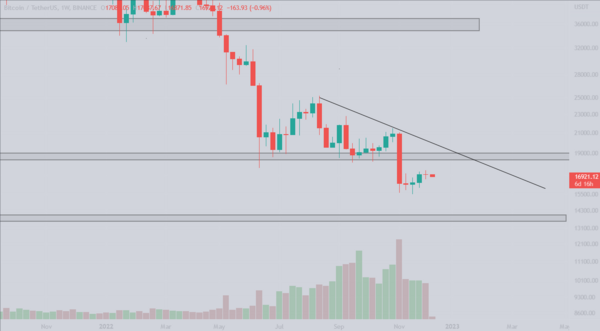
Bitcoin/Dollar Weekly chart
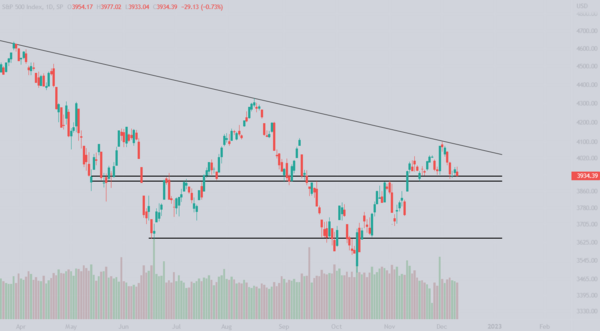
S&P 500
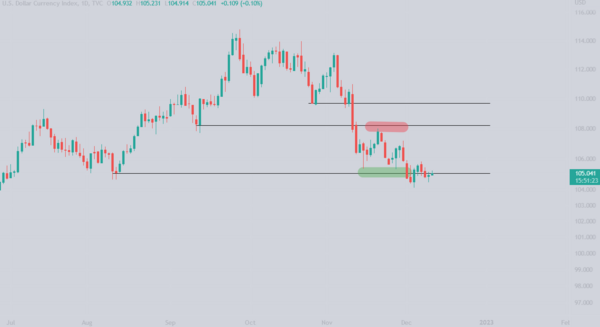
U.S. Dollar index
Bitcoin formes a doji on the weekly after reaching $17,400 earlier this week. A standard doji candle gives us little to no information, however considering the fact that it was printed after two big green candles and we’re seeing decreasing volume, it could lead to downside. The target that we discussed the previous week remains the same. In case Bitcoin pumps, we will be looking for the 2017 ATH zone and the trendline which would be the best place to derisk some if you bought the lows.
The S&P 500 has been rejected by the trendline, as expected on the first test, dropping to the support level that has been tested for the 4th time now. With the upcoming CPI and Fed interest rate hike later this week, I am positive we will see more volatility on SPX as well as Bitcoin. The market is expecting a 0.5% rate hike; if we see it, I am expecting SPX to go higher, in case we get 0.75% we could see markets drop.
DXY is holding its support, which I don’t believe it will hold for much longer. Similar to SPX, everyone is waiting for the CPI and Fed meeting before they make the next move. Even if we get a 0.75% rate hike and pump on DXY I don’t expect the pump to hold for a long time.
Ethereum
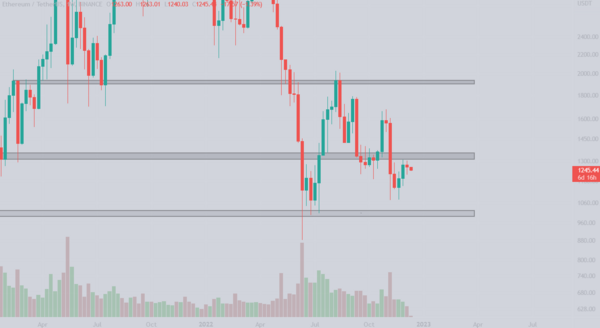
Ethereum/Dollar Weekly chart
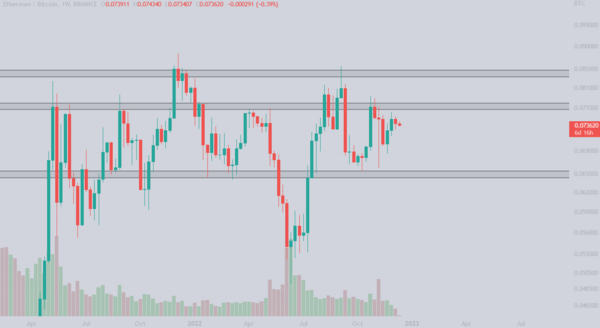
Ethereum/Bitcoin Weekly chart
Ethereum shows a clear rejection from the $1350-$1400 zone along with decreasing volume which is not a good sign for bulls. However, Ethereum is almost glued to Bitcoin’s price action, so if any real movement is seen on BTC, ETH will follow. In case we drop lower, my ideal target would be the $1000 area which I will bid for sure, and going to the upside, the first level that needs to be cleared out is $1350-$1400.
The ETH/BTC chart shows a similar picture to the USD pair. A clear rejection of the 0.077 BTC level which we were hoping ETH would finally break. The plan remains the same as long as we are in this position. We are buying the 0.065 BTC level and selling the 0.077 BTC level.
Blood’s content recap
My view on the industry
It saddens me that the industry hasn’t matured a lot since 2016.
Back then we had multiple exchanges that shared volume, users and liquidity. Exchanges like Kraken, Coinbase etc.
Now Binance has a total monopoly which puts the whole industry at risk..
Exercise
Concluding notes
Plenty of rumors are going around about Binance being insolvent. I never want to spend too much time on stuff that’s still speculation, but there’s a way that you can stop worrying too: have most of your funds in cold storage and only keep what you need for trading on centralized exchanges. Nowadays, there’s really no excuse for keeping everything on a single exchange, especially when pretty much every exchange out there offers a lot of leverage. That’s precisely one of the main purposes behind leverage: you can keep a fraction of your money on the exchange while still trading the same size as usual. When enough profits build up, you withdraw most and only keep what you need for collateral. If you do that, you will not only maximize capital efficiency, but also not have to lose sleep about every single rumor that pops up on Twitter.

