


Bloodgang,
Welcome to the fifty-eight issue of Bloodgood’s notes. The idea of this newsletter is to give you an overview of the previous week’s fundamentals and what happened on charts as well as to remind you of this week’s articles, secret TA tips, and trading calls. Basically, it’s about giving you all the key info in one place.
Table of contents
- Fundamental overview
- Bitcoin and Ethereum chart
- Blood’s content recap
- Concluding notes
As this community grows, I have a duty to give back to all of you that helped me and supported me to become what I am. This free newsletter is just another way to share my experiences and prepare you for the journey that’s ahead of you.
Love,
Blood
Fundamental overview
Last week, the Fed went with its first 50 bps rate hike after four consecutive 75 bps hikes, getting many excited about a potential dovish turn, but Powell made sure to curtail any such hopes by highlighting the need to keep rates higher for longer during the news conference. Make no mistake: the worst of the hikes is behind us and, while we’ll need to wait a while longer to see any cuts, the Fed is definitely starting to change its tune, even if that process is very gradual (as it has to be—unless something is critically broken, that is). When the pivot happens in full force, it will be interesting to see how BTC will react: stocks historically take a while to bottom after a pivot, but it’s reasonable to suppose that BTC could do that sooner, partly because there’s not much historical precedent for it (and hence no self-fulfilling prophecy that it will have to keep dumping after the pivot).
Meanwhile, Elon created a Twitter poll asking whether he should step down as head of Twitter and saying that he’ll abide by the results. So far, more than 16 million people have voted, and 57.5% think that he should step down. This was probably the result of the most universally hated policy change since he bought the company: Twitter has announced that it’s against the rules to advertise other social media platforms or post links to them. Even Vitalik started criticizing the new policy and mocking it by pinning a past tweet about other networks he’s on, so it’s no surprise that the majority voted how they did on the poll. Of course, it’s possible that his intention was to find a suitable replacement in the next few months anyway—probably to focus more on Tesla and SpaceX—but in any case, this kind of extremely entertaining move is something you don’t see that often.
Bitcoin, SPX and Gold
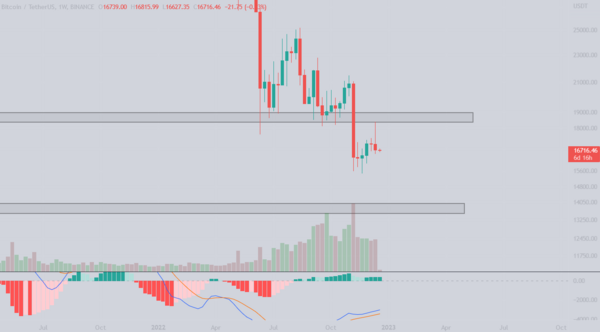
Bitcoin/Dollar Weekly chart
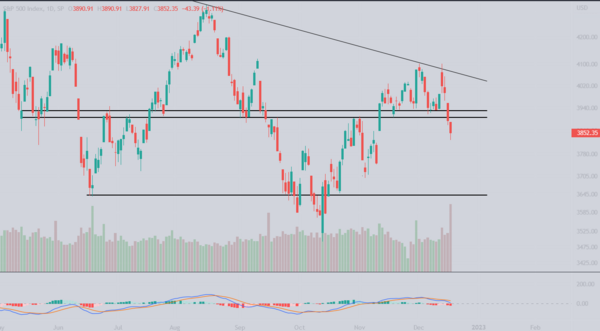
SPX daily chart
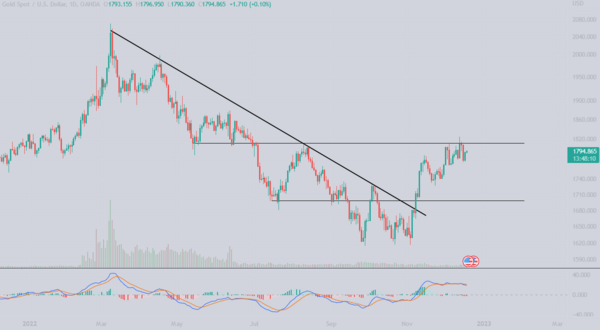
Gold Daily chart
Bitcoin retests the ATH zone for a couple of moments, providing us a golden short opportunity, and then dropping back below $17,000. Inflation came in lower than expected, and traders were bullish as they expected the 0.5% raise by the Fed, which pushed Bitcoin towards $18,000. After the Fed meeting everything crashed since Powell stated that they will remain hawkish. In my opinion, this is a great spot to tell your non-crypto friends that wanted to buy BTC at $60k+ that they should start DCA-ing on a monthly basis, you’ll thank me later.
SPX takes a hit after the Fed meeting and loses the support that was defended for quite some time. Seems like the downtrend line is still too strong. Unless we see strong recovery today after the markets open, we could go down toward the 3600 level once again. If bulls do not defend the 3600 level, we could be making a new low, which could drive Bitcoin way lower.
I decided to take a look at the gold chart this time, since DXY has been dropping without any sign of strength and things aren’t looking too great for USD. Gold broke the downtrend line in November already and since then it has been in an uptrend, formed by 4 higher highs and lows. Currently it’s facing a resistance that seems to be too strong now, but it looks like bulls are pushing for the third time. If they succeed, 1900 is on the menu.
Ethereum
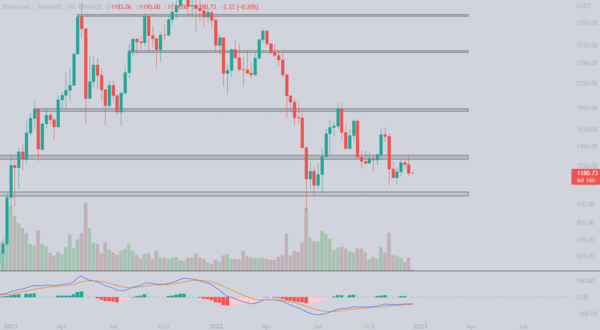
Ethereum/Dollar Weekly chart
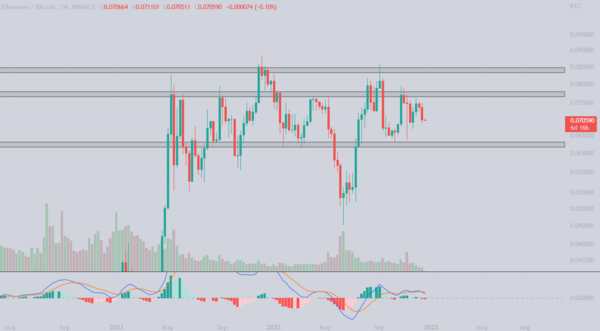
Ethereum/Bitcoin Weekly chart
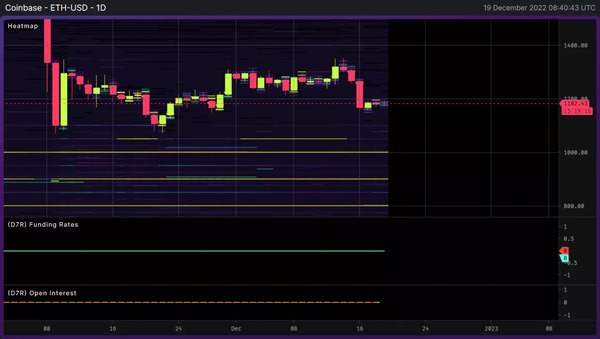
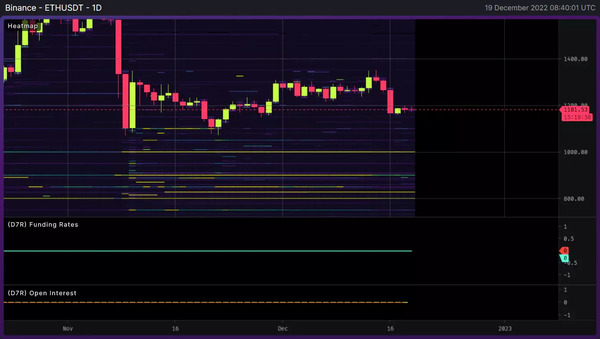
Ethereum has similar price action to Bitcoin, as it got rejected from its key level at $1350-$1400, also providing a golden short opportunity. Ethereum formed the 4th lower high this time, while volume is decreasing indicating that we could finally see the $1000 level tested. By looking at the data, there is a buy wall on Binance Spot, as well as Coinbase, at exactly $1000, so keep that in mind. If we drop towards $1000 I will not only be looking to add more spot ETH, but also look for long opportunities.
Not much is happening on the ETH/BTC chart at the moment, the 0.077 BTC resistance is out of play at the moment, so we should pay attention to the 0.065BTC level which should be reached if the USD pair drops to $1000.
Blood’s content recap
Book Chapter 3 is live on the website.
Do you do perform well under pressure or you prefer to check charts once a day?
This chapter teaches you all about
– Investing
– Positional trading
– Swing trading
– Scalp trading

– Day trading
The next chapter on the menu is “Orderbooks”
Link to the third chapter
What to do when charts pump?
A short cheatsheet.
Concluding notes
Another thing worth mentioning is that there are rumors going around that Saylor sold 6500 BTC over the past 30 days, but this is solely on the basis of on-chain data. When you’re just looking at transactions on the blockchain, you need to be sure that you’ve got the right wallet, but you also need to know where exactly the coins have gone, which is often completely impossible. Even if you see a clear exchange deposit, you can’t tell if it’s someone selling or just adding collateral to a position (in Saylor’s case it’s likely not for the purpose of 100x degen longing illiquid alts, but you get the point). This also explains why there hasn’t been any notable market impact yet—if news like this were confirmed, that would definitely be visible on the chart.
Speaking of news, I’d like to remind you of the most important way to analyze headline-driven market movements to tell where we’re at in the cycle. The bull market doesn’t begin when there’s loads of positive news driving prices higher—by that time, it’s already well underway. Instead, the point at which you should start to be optimistic is much sooner: it’s when there’s still a lot of bad news, but even objectively bad events fail to drive prices lower. That means there are some very big players that are willing to absorb any selling, and that there’s going to be plenty of FOMO shorts that will get trapped and have to cover later. That right there is the environment you should watch out for—we’re not there yet, but when we are, that will be the most important sign.

