


Bloodgang,
Welcome to the sixty-first issue of Bloodgood’s notes. The idea of this newsletter is to give you an overview of the previous week’s fundamentals and what happened on charts as well as to remind you of this week’s articles, secret TA tips, and trading calls. Basically, it’s about giving you all the key info in one place.
Table of contents
- Fundamental overview
- Bitcoin and Ethereum chart
- Blood’s content recap
- Concluding notes
As this community grows, I have a duty to give back to all of you that helped me and supported me to become what I am. This free newsletter is just another way to share my experiences and prepare you for the journey that’s ahead of you.
Love,
Blood
Fundamental overview
This year is getting off to an interesting and—judging by derivatives data, very unexpected—bullish start. Risk-on assets are doing pretty well, but funding rates are negative to neutral across the board in crypto, with plenty of bears still fading the rally.
This means one thing: shorts could get squeezed like crazy, but only if we don’t get any bad surprises from the legacy markets. Luckily, this isn’t one of those insanely event-packed weeks, but we’ve still got the US CPI coming out on Thursday. Expectations for the headline inflation rate are 6.5%, down from 7.1% previously, so if the all-important number comes in at or below this level, that could make for a much bigger rally. Also, some of the narratives I mentioned in the previous newsletter are playing out even better than I expected, and I’ll comment on how to spot more of this alpha in the concluding notes below, after we look at the majors first.
Bitcoin
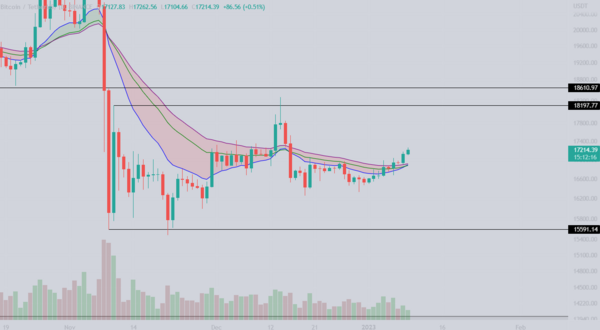
Bitcoin/Dollar Daily chart
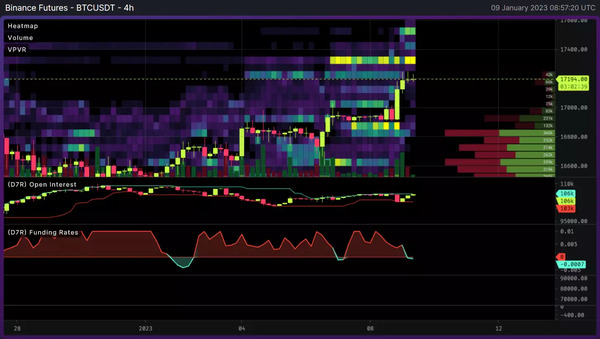
Bitcoin H4 heatmaps Binance
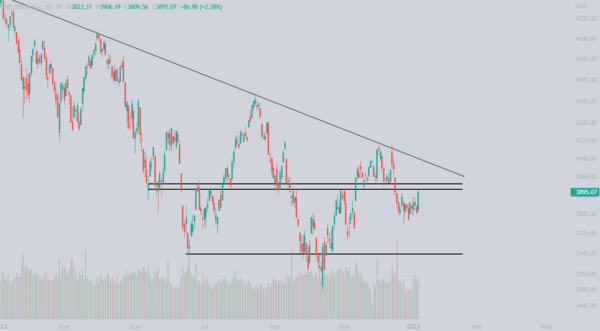
S&P 500
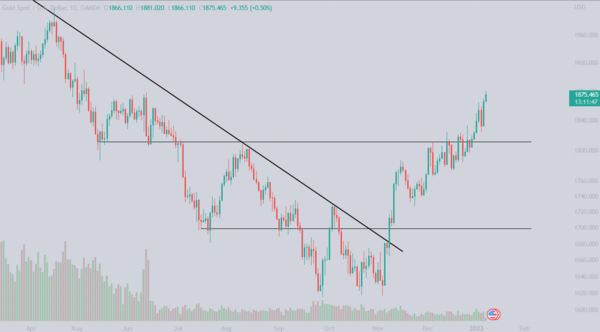
Gold Daily chart
Has Bitcoin woken up from its “holiday mood”? This Monday morning we got $17,000 Bitcoin. In the last letter we were discussing the point of control and Bitcoin was just testing it as a resistance after it had acted as support for quite some time. The good news for bulls is that the PoC was broken and Bitcoin pushed higher, also breaking above the short term EMAs that we were monitoring. The last time Bitcoin pumped above these EMAs we saw a high of $18,400. Looking at the OI and funding rates data, we can see that the pump that happened overnight has woken up some bears as OI started increasing and funding went negative. So we either see these shorts get squeezed or we are in for a retrace soon; the first looks more likely in my mind, unless we get a bearish surprise from the legacy markets.
Luckily, the S&P 500 seems to be waking up as well; after almost 2 weeks of sideways movement it has again pushed towards the resistance we have been monitoring. The first goal for bulls is to break above the mentioned level, but the real test comes when SPX approaches the downtrend line that has been in play since January 2022. Congrats, you have survived one whole year of the downtrend! In any case, do monitor this chart as US markets open, since whatever SPX does, Bitcoin will follow.
What is interesting here is that Gold is also pushing up in correlation with “risk on” assets. It is trading in a perfect staircase pattern, making its way higher. But we know what happens when this pattern breaks. We saw a similar pattern on Ethereum from October 2021 to November 2021 and, needless to say, you know what happened next.
Ethereum
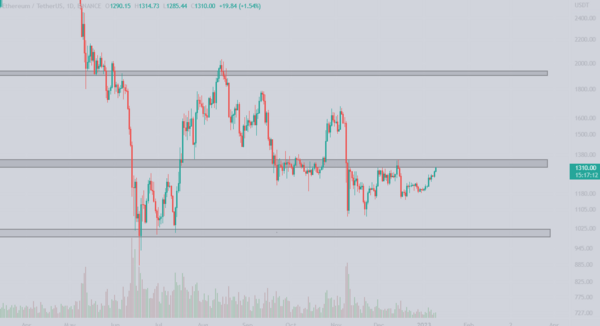
Ethereum/Dollar Daily chart
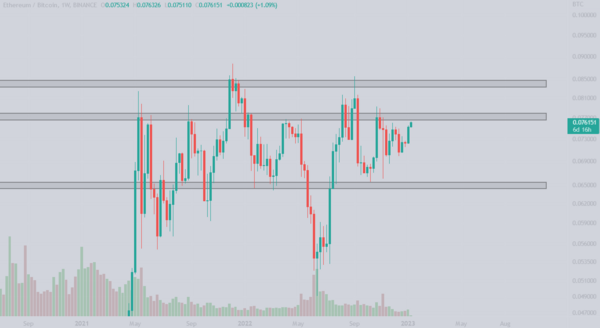
Ethereum/Bitcoin Weekly chart
Simmilarly to what we discussed last week, Ethereum is ahead of Bitcoin (structure wise) and has already approached the key level which lies around $1350-$1400. Even though we are seeing some strength in the price action, volume is decreasing and traders don’t seem to be confident in this move upwards as there is a possibility for another lower high to form around current levels.
In addition, ETH is currently trading right above the daily 100MA which was rejected the last time bulls pushed ETH above $1300. Pushing above and confirming it as support could very well lead to the daily EMA200 at the $1500 level.
The ETH/BTC chart confirms our theory that Ethereum is ahead of Bitcoin in terms of structure, as it is currently retesting the resistance at 0.076 BTC. We have been here many times already and I think you know what to do, right? We have been trading this chart for over a year now, and for some I know it was painful as this chart required a lot of patience and self control. But let this be a lesson. Trading is a waiting game.
Blood’s content recap
New eductional thread
“Cumulative Volume Delta (CVD)
Identify potential buying/selling opportunities.
Confirm your TA & other indicators.
Identify trends/patterns.
Read on to understand how it works and how I use it.”
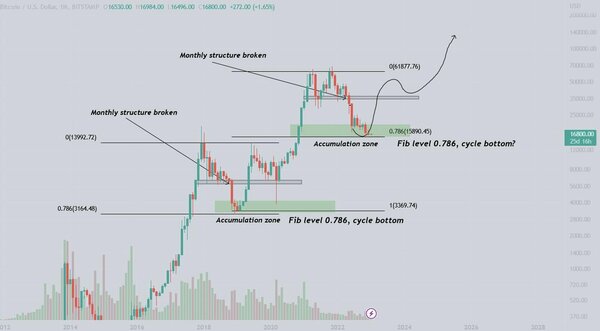
Bitcoin macro update
“..Observing this monthly breakdown since $35k and slowly accumulating the green zone.
Doesn’t have to bottom here, but imo it has good RR.
Trust me, you won’t nail the bottom so draw magic lines and stick to the plan.”
Concluding notes
The two main narratives that I mentioned last time are artificial intelligence and Ethereum staking solutions, driven by the recent hype around ChatGPT and withdrawals coming soon to Ethereum, respectively. AI-related coins have been pumping like mad since the previous newsletter, but probably the most interesting action has been on Lido (LDO)—in any case, I certainly hope you paid attention and got a piece of the action. If not, you can use this opportunity to learn how to predict similar pumps in the future.
What fueled the rally in Lido were excessively enthusiastic bears that faded it hard. For much of the past week, open interest was rising while funding was getting ridiculously negative: at one time you could be making an annualized 400% just by longing it rather than holding spot. With the staking narrative driving a lot of spot buying, the stage was set for the mother of all short squeezes: as the price approached an important resistance level—where shorts had either stop losses or liquidation levels, depending on their level of degeneracy—it pumped almost 50% in a single one minute candle, while OI quickly dropped by 30%. In simpler terms: bears were giga-rekt.
Overall, that is an excellent case study for why derivatives data—especially funding and OI—is important when looking at alts, not just BTC and ETH. In fact, anyone that has enough trading experience would have been able to spot this opportunity quite easily, since the overall pattern—narrative-driven spot buying and excessive shorting—is precisely what happened with the famous DOGE pumps of 2021 (and don’t forget about GameStop either). The takeaway message is simple: when there’s a big narrative going around, fundamental analysis is of course important, but TA and derivatives data can allow you to capture a much bigger move than just relying on FA and holding spot, while also earning 1%+ per day from funding.

