


Bloodgang,
Welcome to the sixty-second issue of Bloodgood’s notes. The idea of this newsletter is to give you an overview of the previous week’s fundamentals and what happened on charts as well as to remind you of this week’s articles, secret TA tips, and trading calls. Basically, it’s about giving you all the key info in one place.
Table of contents
- Fundamental overview
- Bitcoin and Ethereum chart
- Blood’s content recap
- Concluding notes
As this community grows, I have a duty to give back to all of you that helped me and supported me to become what I am. This free newsletter is just another way to share my experiences and prepare you for the journey that’s ahead of you.
Love,
Blood
Fundamental overview
We’re finally seeing the return of volatility, and luckily it’s to the upside: just like I mentioned previously, shorts got squeezed left and right, with many bears persistently fading the rally only to add fuel to the fire as their stops kept getting run. Many of the narrative-driven plays that I talked about two weeks ago—Ethereum liquid staking protocols and the AI sector—continued to outperform over the last week as well.
With that said, now is a good time to look at higher time frame charts in order to put things in perspective. For example, the Nasdaq index is testing its MA 200 on the weekly from below, right after bouncing off of the 0.618 Fib retracement of the move up from the March 2020 lows. In other words, this isn’t the time to get too greedy, but rather observe carefully how things play out with stocks. As for headline risk, we haven’t got too much of a packed week ahead of us, with the exception of the PPI (Producer Price Index) coming out on Wednesday. Also, US stock markets are closed today, so there’s still some time to trade crypto without needing to worry about whether the S&P 500 will suddenly drag Bitcoin down with it.
Bitcoin, SPX and Gold
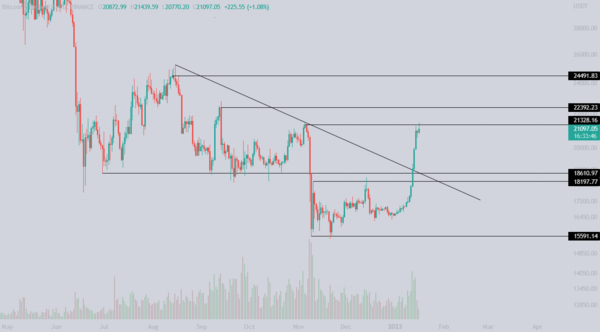
Bitcoin/Dollar Daily chart
S&P500 Daily chart
Gold Daily chart
Well, we talked about shorts getting squeezed in the previous letter when Bitcoin was trading at $17,000 and we can safely say that many were rekt on this move up. Moreover, there is still a lot of sidelined money, waiting for a higher high to form before entering. There are 3 stablecoins in the top 7 assets right now—that money is waiting to be allocated first to majors and then to alts when the time comes. Back to the chart, the weekly candle pumped by 22%, which is insane, although by looking at the daily chart we can see that we are currently testing the last weekly lower high before dropping to $16,000. We might see some resistance here, so again no trade zone for me. We have seen a lot of coins pump this week, so be careful, we could see a retrace before going higher. In case we keep pushing up, I have drawn daily levels that I will be monitoring for short/long positions.
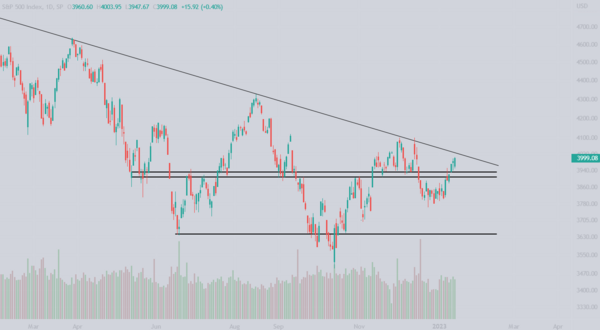
The S&P 500 has once again broken above the resistance that lies around 1925 and is closing in on the downtrend line; breaking the downtrend line that was too hard to break since January 2022 could trigger Bitcoin to pump to $30,000 fairly quickly.
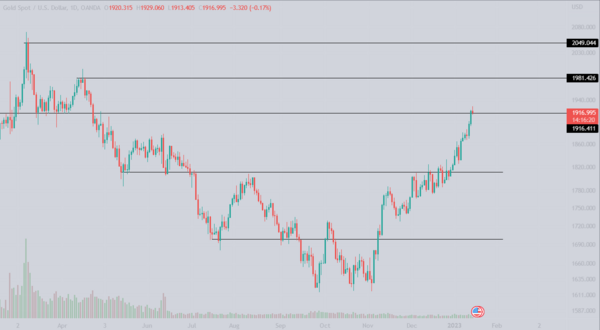
Gold doesn’t seem to stop pumping. The daily chart has just closed above the $1,916 level and is looking to go toward $1,981, and that is the last level before all time highs. We could see gold reach all time highs in the next few months.
Ethereum
Ethereum/Dollar Daily chart
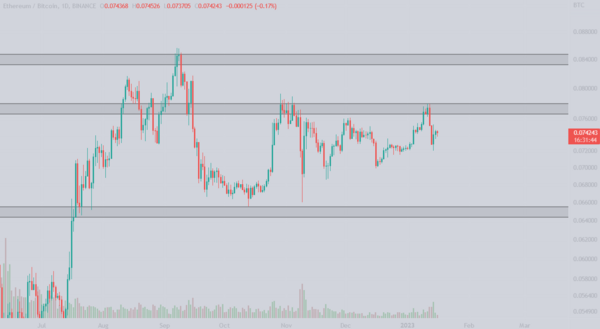
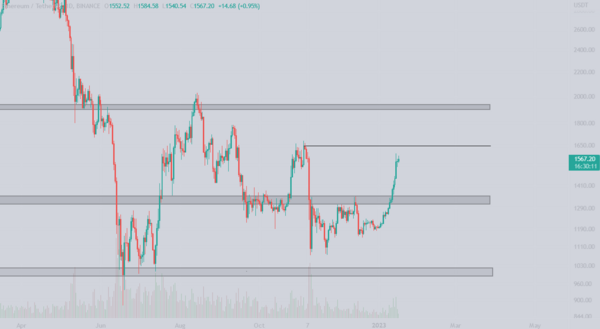
Ethereum/Bitcoin Daily chart
Ethereum has followed Bitcoins movement pretty well in the last week as it also printed a 21% weekly candle.
Looking at the daily chart we can see that Ethereum broke above the level we were watching at $1350-$1400 with increasing volume which is a sign of strength. ETH has also broken above the daily EMA 200 which is another sign of strength, if it holds of course. If this would end up being a fakeout we would see a lot of panic sells in my opinion, dropping back below $1350.
The ETH/BTC chart keeps repeating itself. The 0.078 BTC level is still too strong and ETH has been rejected once again. Sadly the Ethereum that I had for trading this chart was already sold to Bitcoin, and I am waiting for either the 0.066 BTC level to be reached again or a confirmed breakout of the 0.078 BTC level.
Blood’s content recap
Cycle of a crypto trader
“1. Spends hours studying risk mng., patterns, etc
2. Backtests a pattern
3. Patiently waits for Long/short zone
4. Opens position
5. Sees a big following profile with an opposite position
6. Closes position & follows him
7. Rekt
Trust your system”
Markets are difficult to trade with so many complex factors.
.. But they all boil down to one thing..
USD liquidity conditions.
When Fed starts injecting more money into the economy, markets will rally.
Keep in mind that’s WHEN not IF.
Concluding notes
You may have noticed how quickly sentiment can change over the past two weeks. That’s how it often goes: first there’s a hated rally, consistently shorted by overzealous bears, that just keeps going and going. Then, by the time the average Joe catches up and decides to step in as sentiment becomes euphoric and funding rates go from neutral or negative to aggressively positive, that’s typically when the rally is exhausted—but often the dump is preceded by a fakeout to the upside, trapping even more late bulls.
History doesn’t repeat, but it sure does rhyme, which is why it’s incredibly important to study the charts and observe how rallies start and end. I’m not saying the current rally is over—I think much will depend on what stocks decide to do this week—but simply highlighting the key principle of trading: never get caught up in either greed or despair, whether your own or (more commonly and more dangerously) that of broader market sentiment. Reflect, study, backtest and then—and only then—execute with conviction.

