


Bloodgang,
Welcome to this week’s issue of Bloodgood’s notes. The idea of this newsletter is to give you an overview of the previous week’s fundamentals and what happened on charts as well as to remind you of this week’s articles, secret TA tips, and trading calls. Basically, it’s about giving you all the key info in one place.
Table of contents
- Fundamental overview
- Bitcoin and Ethereum chart
- Blood’s content recap
- Concluding notes
As this community grows, I have a duty to give back to all of you that helped me and supported me to become what I am. This free newsletter is just another way to share my experiences and prepare you for the journey that’s ahead of you.
Love,
Blood
100th Issue of Bloodgood’s Notes, geopolitical escalation in Israel, SBF trial and more
Fundamental overview
I just noticed that this is the 100th issue of Bloodgood’s notes, right as we’re entering what is historically the most bullish part of the year for both stocks and Bitcoin. I’m grateful to all of you—whether you stuck around from issue 1 or just joined more recently—and I look forward to bigger milestones.
Unfortunately, though, it’s hard to be in a celebratory mood with another major geopolitical escalation in and around Israel. This isn’t the place to cover that in any detail—it’s simply too important to attempt to summarize everything fairly in a few sentences—and I know most of you are here for the market-related stuff anyway. In that context, the number one thing to watch out for is any potential involvement by Iran, since that could send shockwaves through the global economy, starting with the oil markets.
Prior to the conflict, it seems that most analysts had been talking about nothing but debt, singing an overall gloomy tune that would make any price shocks that much harder to bear for the US and Europe. Of course, it’s way too easy to point at a chart of US debt and/or an inverted yield curve and say everything is going to collapse, but the thing about such predictions of doom is that they’re useless for trading or investing unless they have a time component. Debt has been growing for a long time, and the US economy has held up much better than most people expected.
With that in mind, it’s best not to be too confident in any crazy predictions, but it’s still important to have a look at the objective data right now. The US SPR (Strategic Petroleum Reserve) has been down only for a while now, and oil reserves have dropped by almost 50% since the start of 2021, reaching levels that haven’t been seen since 1983. In the meantime, bonds are selling off like crazy with yields ripping to highs that haven’t been touched since 2007. In that kind of an environment, an oil price shock would have severe repercussions. To get a sense of what can happen, I’d highly recommend reading up a bit on the 1973 and 1979 oil crises.
Now that the doom and gloom is out of the way, let’s look at the charts—at least some of them paint a prettier picture.
Bitcoin
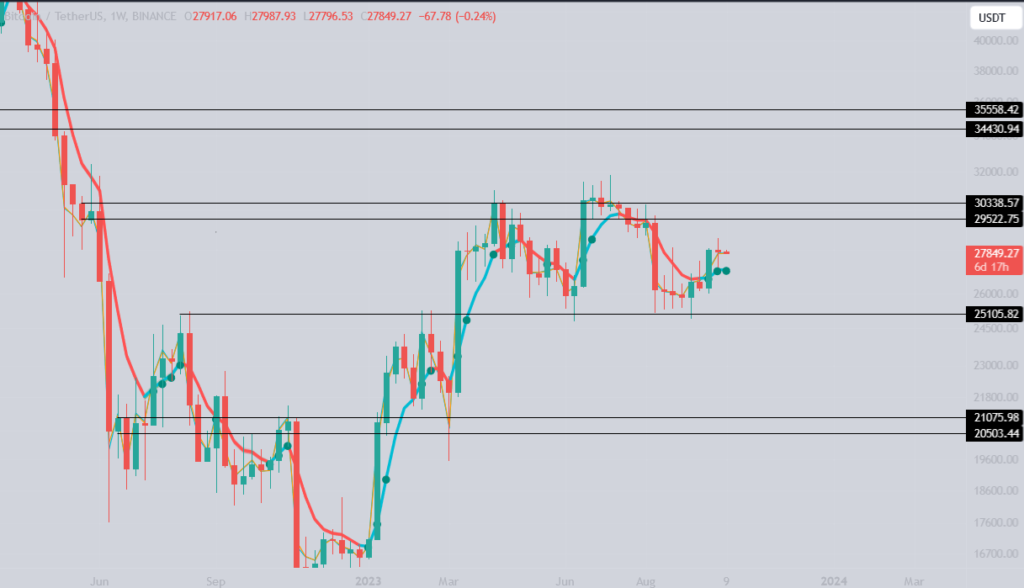
Bitcoin Weekly
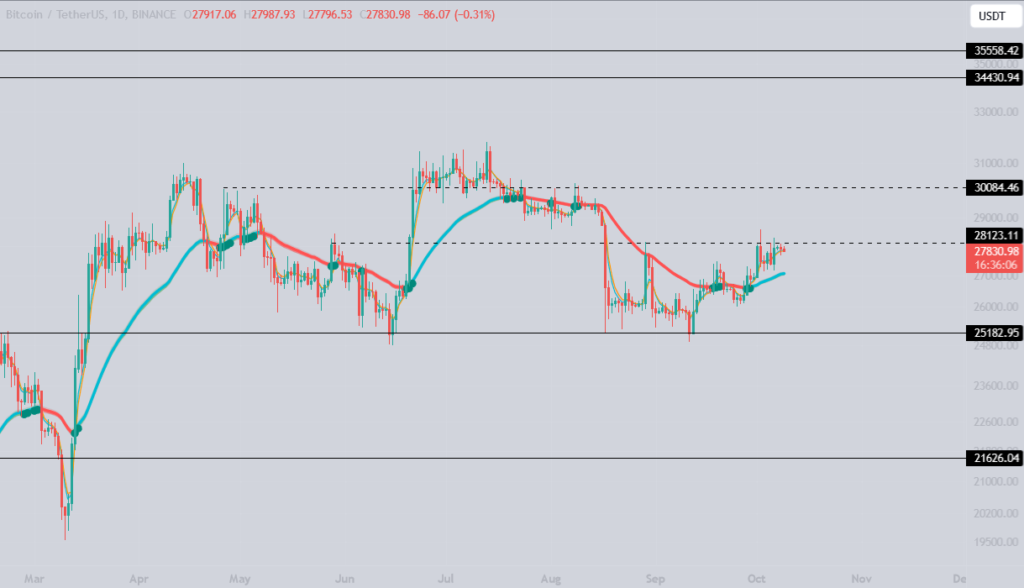
Bitcoin Daily
Green October continues as Bitcoin bounces off the $27,200 support.
A rally that started at the beginning of the month pushed Bitcoin over the daily resistance and reached $28,600. On the weekly timeframe a long-legged Doji was printed which is an indicator of indecision between bulls and bears. However, Bitcoin is still trading above the Bloodswing indicator and as long as it remains there I will consider this a reversal.
Looking deeper into the daily timeframe we can see that BTC is stuck under the resistance level, unable to break above. If we want to see real strength, bulls must break the $29,500 resistance where we have weekly, monthly and daily levels as well as the psychological $30,000 level.
In case we lose $27,200 I will see this as a fakekout that will likely drop back to the $25k region, bringing a few more months of pain.
SPX, Gold and DXY
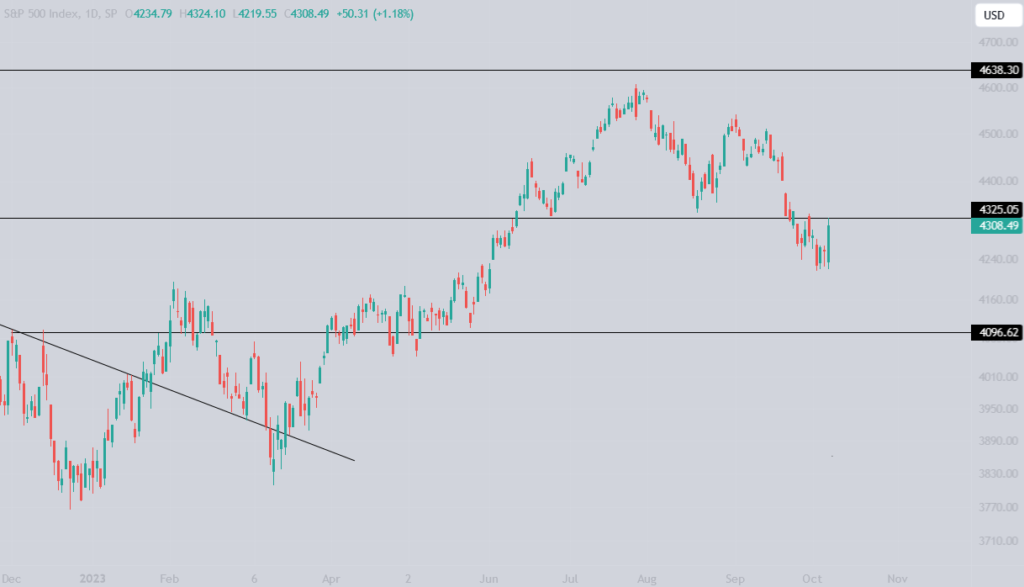
S&P 500
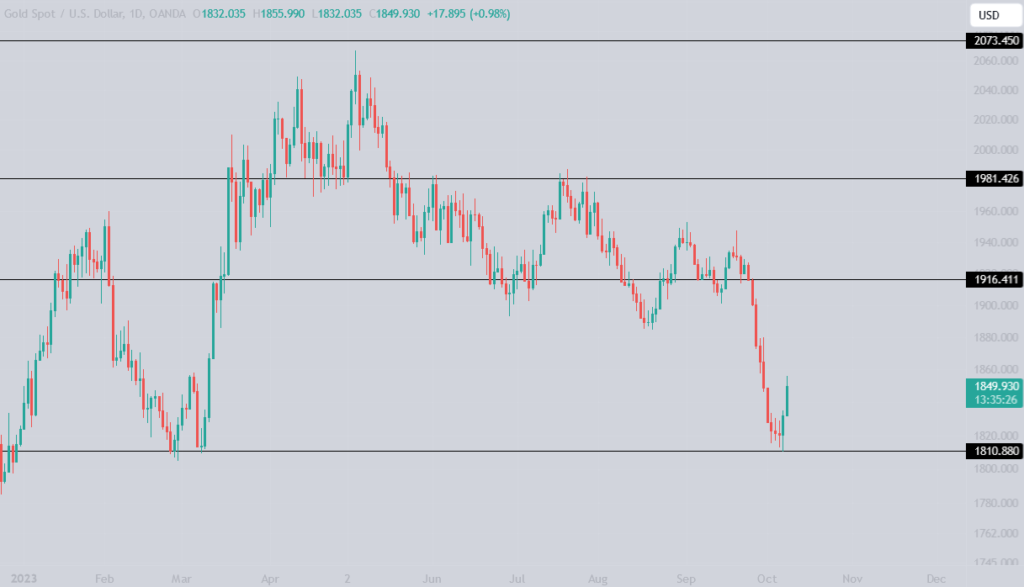
Gold
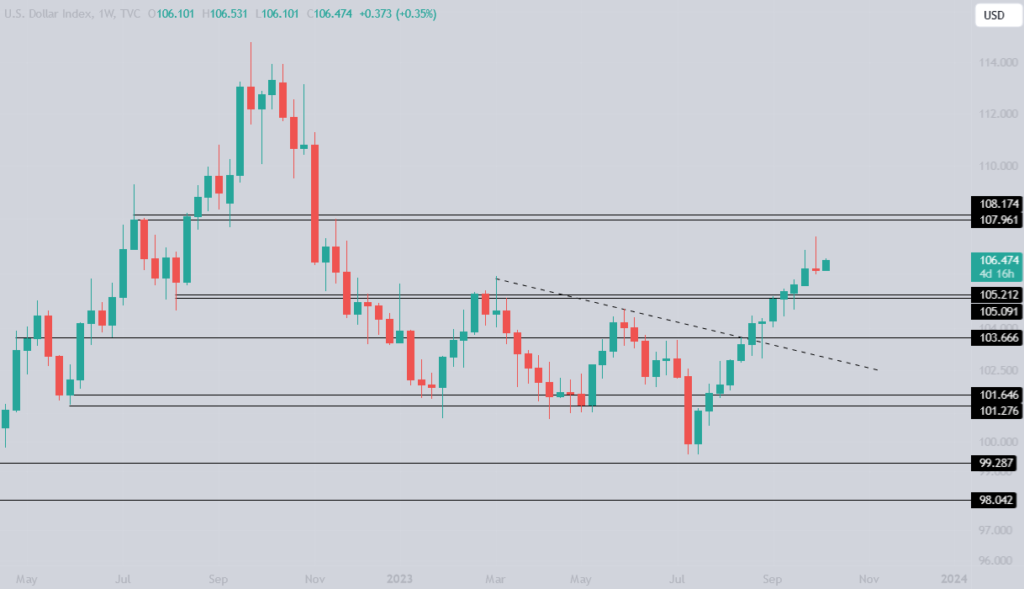
U.S. Dollar Index
Stocks show strength after losing an important level.
An important breakout level at $4325 was lost and stocks were on a path towards $4096 which we said we would bid. Before markets closed on Friday, SPX made a move higher and is at the moment of writing stuck under the monthly level.
I am still convinced that if this level is not broken soon, we will see $4096 tested. If that happens, Bitcoin will have a tough time holding the $27200 level. Also, given the current geopolitical climate, expect more volatility than usual once the markets open.
Gold’s price rises $25 in less than a day.
After 1916 finally gave up we have seen a ~5% weekly red candle towards the $1810 level. As mentioned, the 1810 level worked like a magnet and indeed we got a touch and a strong bounce off the level. If the level does not hold i will look towards the $1750 level which is the next area of weekly support.
DXY prints a red weekly candle, retracing the whole week’s bounce.
The good news for traders that trade risk-on assets is that the previous weekly candle on DXY printed a Gravestone Doji which is a reversal indicator. Even though there is a green candle at the time of writing, let’s wait and see what happens by the end of the week, especially since we have CPI numbers coming in on Thursday.
Previous CPI y/y was 3.7% and the forecast for this month is 3.6%, which should be a good sign for risk on assets and bad sign for USD if we don’t get any bad surprises.
Ethereum
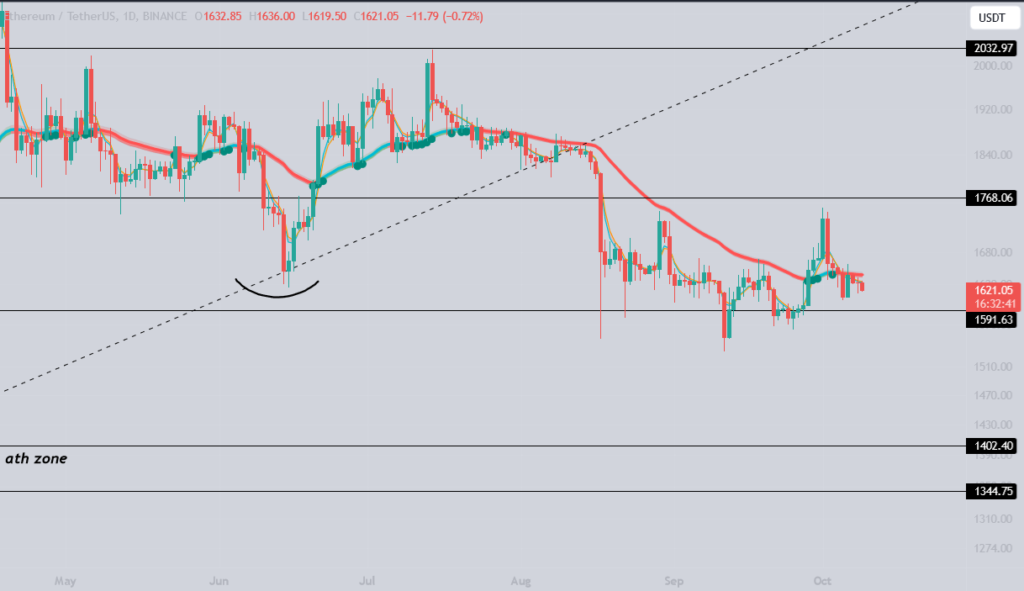
Ethereum Daily
Ethereum retraces the pump and continues its slow bleed towards $1400.
We have seen a few green days at the beginning of the month due to the Ethereum futures ETF narrative, but that didn’t last long enough to make it interesting. Given the low volumes around these events, it’s not surprising to see traders lose hope.
As seen from the ETH daily chart, bulls managed to push Ethereum back above the Bloodswing indicator and break the series of lower highs, however it could not break above the important $1768 level.
At the time of writing, Ethereum is back below the Bloodswing indicator and closing in on the $1591 level which looks weak since it had been broken quite a few times. A strong breakdown will lead ETH to $1400.
Blood’s content recap
The system will get you if you don’t have faith
“Bloodgood’s Crypto Trading Guide: Last Chapter is available for FREE in PDF on my Website.
In this chapter you will Learn:
– Defi
– NFTs
– Practical Tips
– My thoughts on L1s, Gamefi and Metaverse
Book is now complete and FREE to read on website.
Study it.”
Concluding notes
In crypto—at least the portion of crypto people that haven’t suddenly pivoted to being geopolitics experts—the SBF trial is the talk of the town, and for good reason. As the trial is progressing, we’ve learned a lot of things, many of them not too surprising. To sum it up: Sam was worse than people thought and knew that they were underwater at least since summer 2022, Alameda had a backdoor for a long time, and the defense has been very unconvincing so far.
One of the strangest things is that we now know what many were speculating, namely that Alameda could execute trades faster than anyone else on FTX. What this means is that they essentially had a money-printing machine—a completely fraudulent one, but a money-printer no less—and yet they still managed to blow things up worse than anyone could have imagined. All in all, it goes to show that extreme greed coupled with a belief that the end justifies the means and a love of taking too much risk (especially when it’s other people’s money at stake) is a deadly combo.

