


Bloodgang,
Welcome to this week’s issue of Bloodgood’s notes. The idea of this newsletter is to give you an overview of the previous week’s fundamentals and what happened on charts as well as to remind you of this week’s articles, secret TA tips, and trading calls. Basically, it’s about giving you all the key info in one place.
Table of contents
- Fundamental overview
- Bitcoin and Ethereum chart
- Blood’s content recap
- Concluding notes
As this community grows, I have a duty to give back to all of you that helped me and supported me to become what I am. This free newsletter is just another way to share my experiences and prepare you for the journey that’s ahead of you.
Love,
Blood
Dry liquidity in crypto, more shorts pile on S&P 500, what to expect?
Fundamental overview
I really didn’t want to keep mentioning net positioning on the S&P 500, but I have to as the shorts just keep piling on. What’s most interesting is that this kind of activity is more typical during draw downs; for example, the last time positioning was extremely unbalanced (although not as much as now) was in mid June 2020. After the Covid crash, stocks rallied by almost 50% in Q2, and the moment there was a slight correction, everyone thought the whole thing was just a dead cat bounce and went crazy with the red button. Sure enough—as is often the case when everyone thinks they’re a genius—the shorts got blown to smithereens as the index went up more than 60% from the bottom of the correction and the super negative positioning print.
Given that positioning is even more short now, does that mean that we should expect the mother of all bull markets that would even put 2021 to shame? Unfortunately things aren’t that simple, and you never want to base your macro thesis on just one indicator anyway. As a side note, there are way too many people that do that in crypto, along with being stubborn in general, and they’re typically the ones that are constantly bearish during 100+% rallies. Instead of doing that, you want to always adapt as the macro environment changes and new data comes out. Returning to the topic of positioning on the S&P 500, one important difference is that this time the shorts are getting more and more aggressive in a boring market that has already rallied 10% off the March low, and besides, there’s hardly any sort of comparison between Q2 2020 and the current market conditions. In brief, while I doubt that all those shorts will turn out to be geniuses, it probably wouldn’t take too much to blow many of them out of the water; maybe just a swing high above 4200 would do the trick.
Bitcoin

Bitcoin Weekly
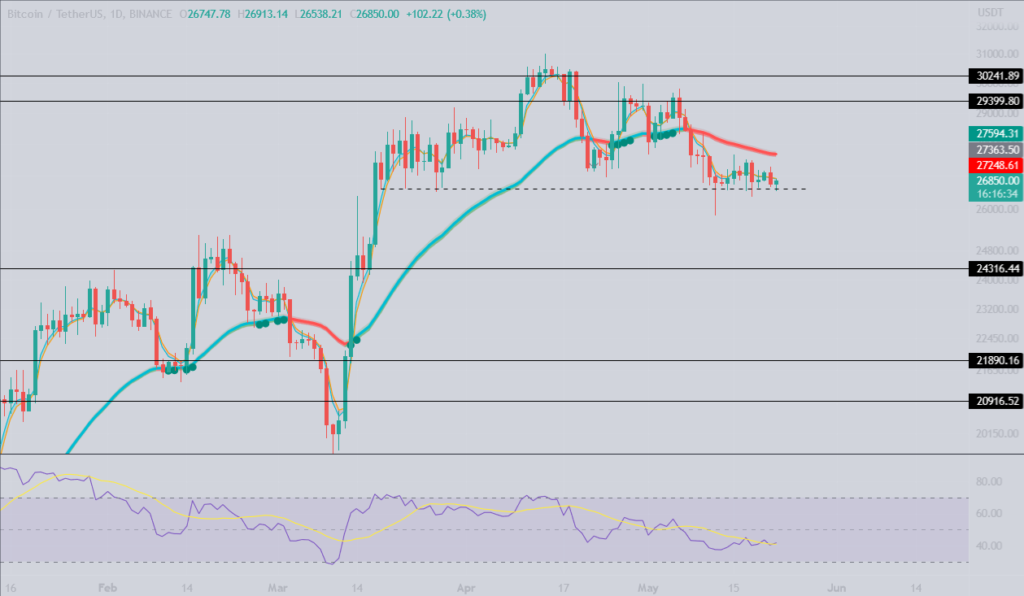
Bitcoin Daily
Bitcoin remains in rejection mode.
As we’ve discussed in previous letters, failed breakouts should not be taken lightly, as they tend to be extremely bearish. However, the current situation is starting to look like a slow bleed. Fakeouts are usually followed by a strong move in one direction or the other, which hasn’t yet happened. This leads me to believe that this retrace might soon be over.
If we continue on a downward trend, I expect this retracement to bring us closer to the weekly level at $24,300. This would still qualify as a healthy retrace and print a higher low. While many may flip bearish during events like this, my perspective is still bullish. A pattern of higher highs and lows signifies an uptrend as long as it’s not broken, at least in my book.
Delving deeper, the daily timeframe indicates that bulls are highly determined to defend the $26,500 level. Bears have twice managed to push BTC below $26,500, but both attempts have failed as buyers immediately picked up the slack.
If $26,500 is broken, we can expect to see $24,316 reached in no time.
SPX, Gold and DXY
S&P 500
Gold
U.S. Dollar Index
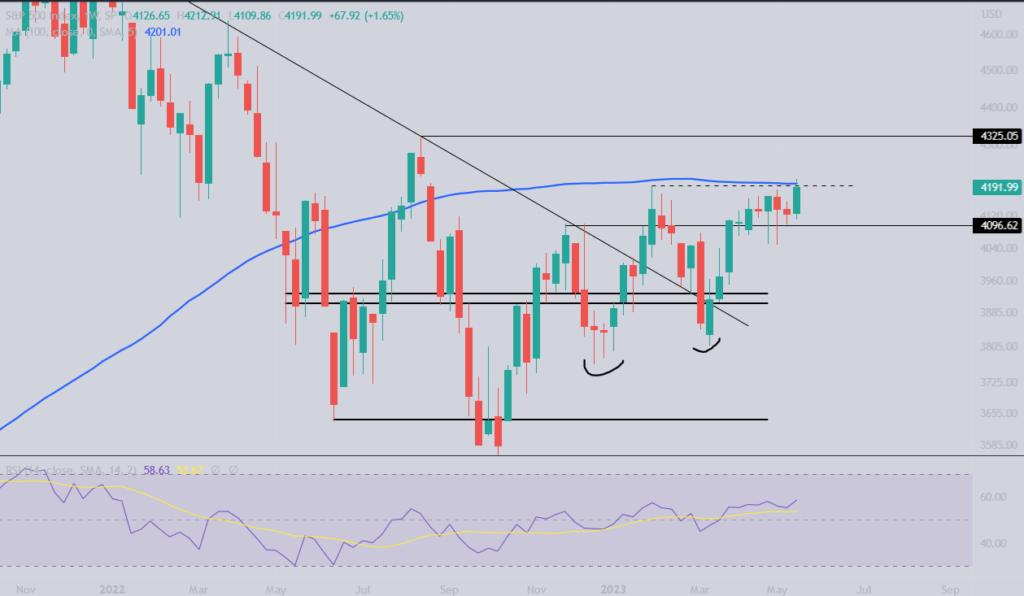
S&P 500 pushes back to resistance.
The S&P 500 showed bullish price action over the last week as it returned to the weekly 100MA, a level that was too hard to crack in February. Stonk bulls defended the 4096 level in a similar way to Bitcoin bulls defending the $26,500 mark. I’ll be keeping a close eye on this level as it’s of key importance for continuation on the S&P 500.
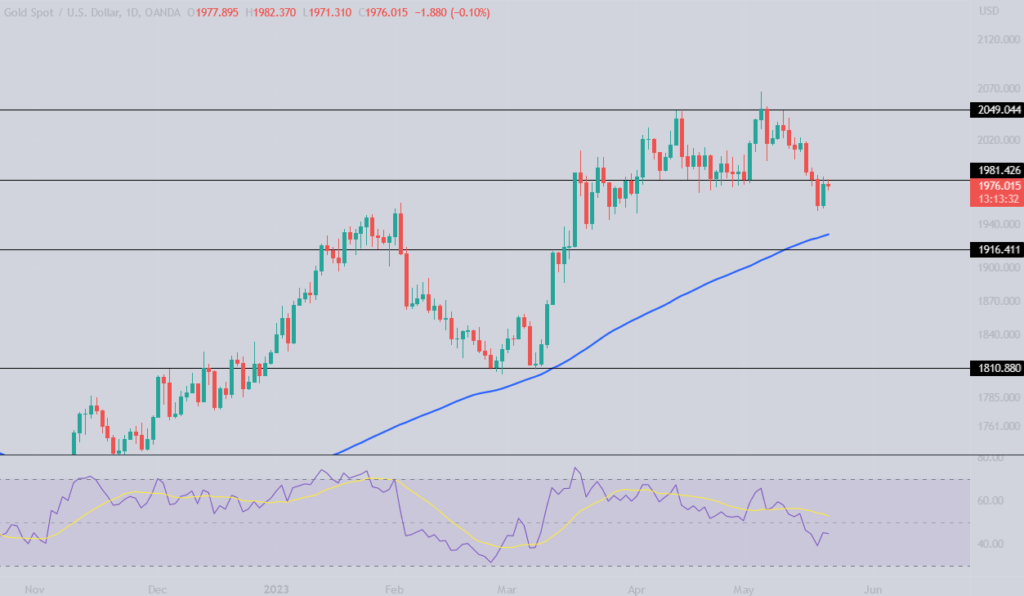
Gold, on the other hand, is breaking down.
After a rejection at all time highs, we’ve seen a breakdown from the crucial support level at 1981, which had been defended for a long time. We’ll soon see whether this is a fakeout or not. If it’s not a fakeout, we can expect the 1916 level to be reached sooner rather than later.
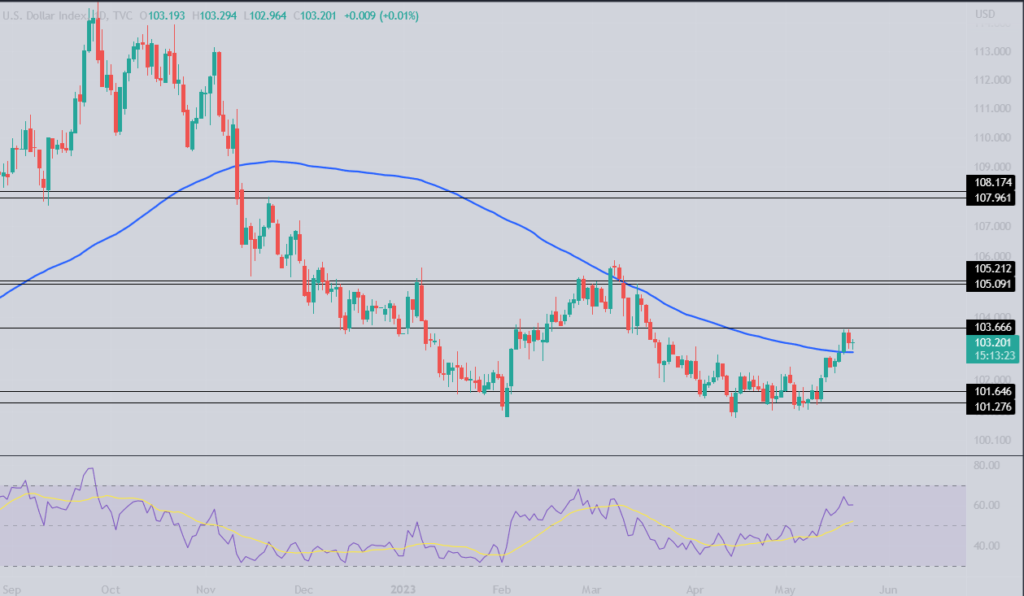
DXY is drawing attention as it rallies back to the 103.66 mark.
As discussed in the previous letter, the 103.66 level is a “make or break” point for the U.S. Dollar Index. Breaking above this level could trigger continuation and difficult times for risk-on assets. If the level is rejected, then it would suggest that a lower high has been printed, with more downside and new lows to be expected.
Ethereum
Ethereum Daily
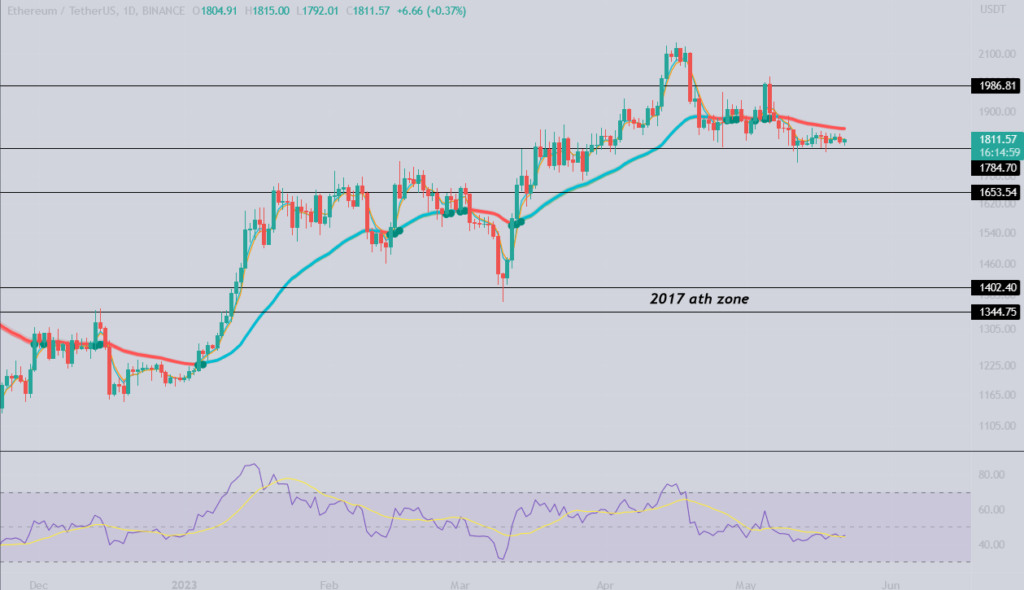
Ethereum remains boring.
In the case of Ethereum, there’s not much change from the previous week. The key levels to keep an eye on are still the low point at $1,784 and the high at $1,986. Similar to Bitcoin’s situation with the $26,500 level, Ethereum needs to hold $1,784 if we want to see $1,986.
If this level is broken, we could see $1,653 very soon. The Relative Strength Index (RSI) is also not looking too good, as it’s below 50 and in a downtrend. This is generally perceived as a bearish signal. I don’t suggest entering until this downtrend is broken.
Right now, Bitcoin is grabbing all the attention, so I am staying away from alts unless I see more interest. I’ll post updates on Twitter if anything changes.
Blood’s content recap
Trading Exercise
“Trading Exercise: Calculate Your Position Size
1. Choose the coin you want to trade
2. Decide where you want to enter and your invalidation (SL)
3. Measure the distance from entry to SL in % (e.g. 2%)
4. Figure out your Risk (how much you are ok with losing if SL is hit) – e.g. $100
5. Divide risk with % distance from entry to SL (100/0.02= 5000 USD)
6. Your position size should be 5k USD and if SL is hit you will lose 100 USD
All clear?“
New Book chapter PDF
“Crypto Trading Guide Chapter 6 PDF is live on my website!
Topic: Psychology
Study 8 pages and learn:
– Psychology of Trading
– Emotions trader faces
– How to master Trader Psychology
– Understand human emotions
There is one more chapter in my book after this one.
Lets go 🚀”
See Book chapters PDF here.
Concluding notes
I don’t know if you’ve noticed, but liquidity has really dried out in crypto, as daily exchange volumes are down over 75% from their recent high in March. Apart from just showing an overall lack of interest in crypto at the moment, this is also largely due to some trading firms that decided to get out of the market, as well as the recent issues with banks that many companies used to get money into and out of crypto in the US. You’re probably not a huge fan of the banking system—and neither am I—but as things stand, we can only have a healthy market if people have an easy way to move their USD into crypto. Until crypto payments become ubiquitous, that’s just the way it will be.
This also has an important consequence for traders. With liquidity at such a low level (and memecoins sucking up the little volume that’s left), it’s much easier for BTC to move by a lot in either direction. Something like a bigger market order that would otherwise be absorbed without showing up on the chart at all could lead to a nasty wick, and any unexpected announcements about crypto from governments or big companies would move the price way more. If you’re doing any leverage trading, you need to be extremely careful about position size in this kind of a market, so be sure to check out the guide to sizing your trades in the content recap above. With that said, sometimes the best approach to leverage trading in a market like this is just to avoid it altogether and wait for a less predatory environment.

