


Bloodgang,
Welcome to this week’s issue of Bloodgood’s notes. The idea of this newsletter is to give you an overview of the previous week’s fundamentals and what happened on charts as well as to remind you of this week’s articles, secret TA tips, and trading calls. Basically, it’s about giving you all the key info in one place.
Table of contents
- Fundamental overview
- Bitcoin and Ethereum chart
- Blood’s content recap
- Concluding notes
As this community grows, I have a duty to give back to all of you that helped me and supported me to become what I am. This free newsletter is just another way to share my experiences and prepare you for the journey that’s ahead of you.
Love,
Blood
Debt Ceiling passed, S&P 500 breaks the year long resistance & will DXY break the downtrend?
Fundamental overview
As expected, the debt ceiling deal, which completely suspends the limit to how much the US government can borrow until 2025 and which I covered in the previous newsletter, passed the House and the Senate. Interestingly enough, this led to a fairly good week for stocks, even though most people seemed convinced that either outcome (i.e. whether a deal is reached or not) would be bearish. The rally was also helped in no small part by the excessive short positioning that I mentioned repeatedly over the past few weeks, and now all eyes are on the CPI and the next Fed meeting, both of which are coming next week.
For now, it looks like the most likely outcome is for the Fed to pause at next week’s meeting, but they might still resume hikes in July. In spite of many traders’ hopes for a definitive pivot and rate cuts, the Fed has made it pretty clear that they only intend to pause hikes to see what kind of an effect that will have, before deciding on whether or not to continue cranking up the stress on the US economy in July. That, of course, is under the assumption that nothing breaks in the meantime, but the market has been strangely optimistic recently, showing another aspect of the importance of narratives. After going through multiple scenarios on how the hike cycle will end, many are now apparently convinced that the Fed will manage to get inflation back to the target rate without causing either a severe recession or more irreparable damage to the US banking sector. Whether that optimism is justified remains to be seen.
Bitcoin
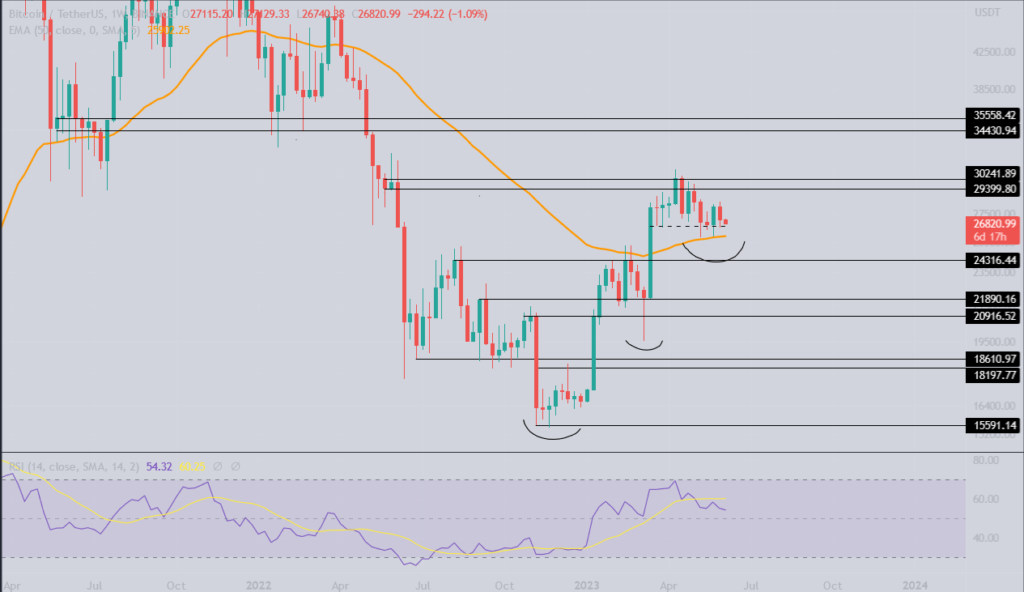
BTC weekly
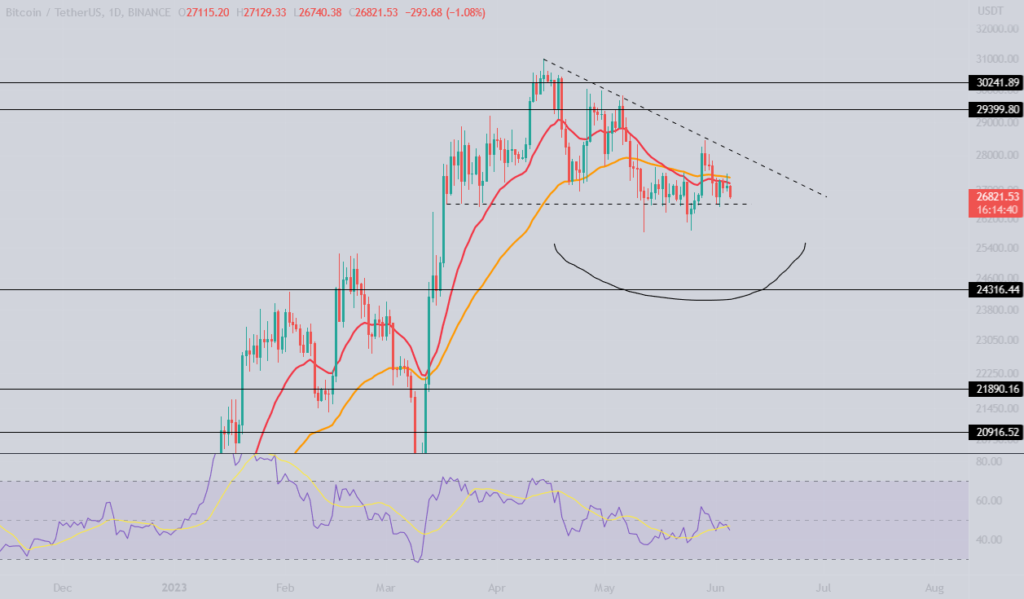
Bitcoin Daily
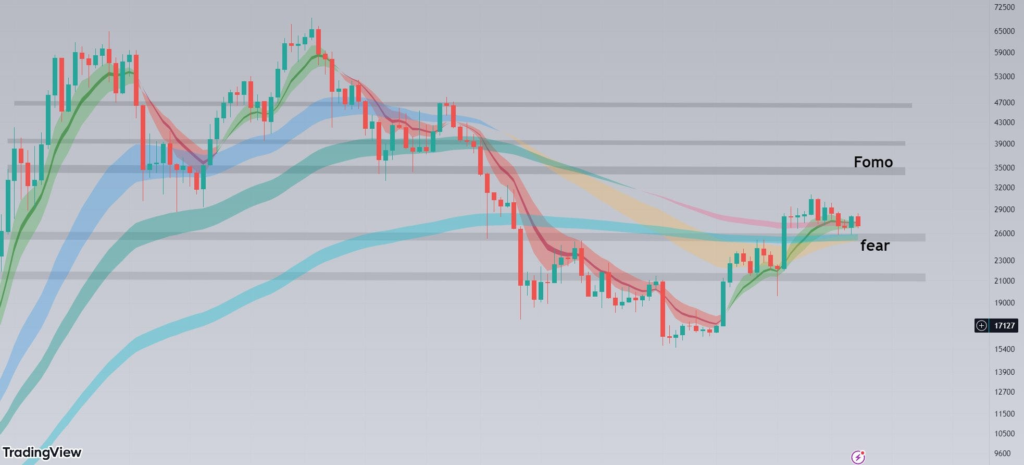
Bitcoin is unable to break above the trendline, retracing the strength it showed in the previous week.
The weekly 50 EMA is once again in our sights as Bitcoin’s price approaches the $26,500 daily level. Having bounced twice from the EMA, resulting in a small bounce followed by a retrace, we’re left to wonder: will the third time be the charm, or will the EMA finally give way?
Despite the recent downtrend that has seen Bitcoin’s trading volume halve since the start of March, a broader perspective reveals an unbroken uptrend with the potential for a higher low. The RSI, too, has been on a downward trajectory, edging closer to the 50 area. Bulls want to see it above this level; otherwise, we could be in for some turbulence.
The daily timeframe is showing the importance of the $26,500 level for bulls. With the price trading below the short-term trend, we’re waiting for the short-term EMA to break above the long-term EMA for a potential swing trade.
As always, keep a close eye on key levels. On the daily chart, support is at $26,500, and for continuation, we’re looking for a break above the $27,500-$28,000 range. If we drop below daily support, consider placing bids at the weekly level of $24,300.
SPX, Gold and DXY
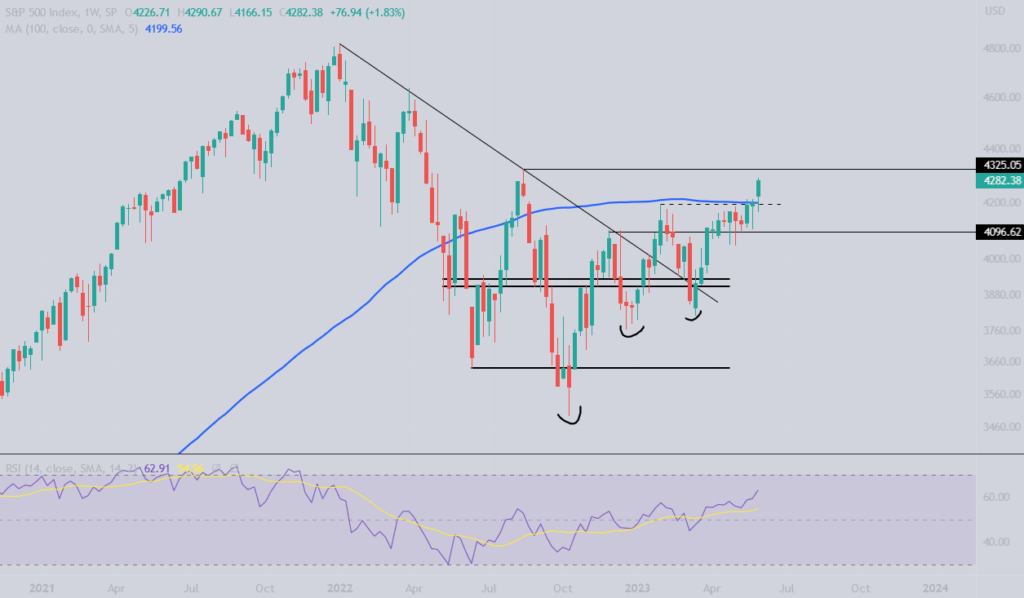
S&P 500
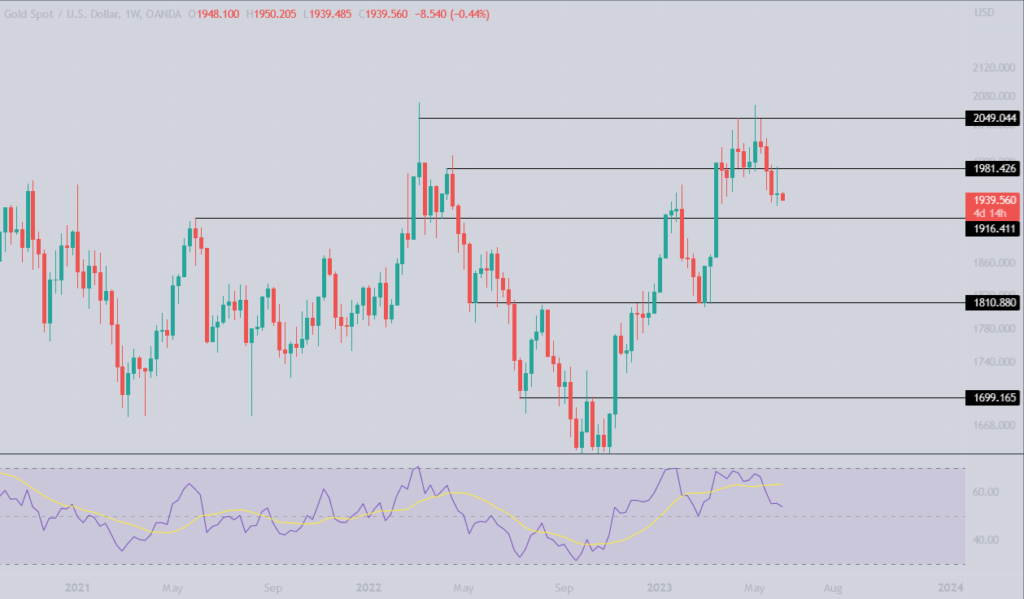
Gold
DXY
The S&P 500 finally breaks the stubborn weekly MA100.
A full year has passed since the S&P 500 last broke the 100 MA, establishing a lower high at 4325, which now acts as resistance. As markets reopen today, I’m waiting to see how they move as crypto has retraced yet again. Still, the uptrend in stocks is a good sign for risk-on assets, provided it holds.
Gold takes a tumble.
An attempt to reclaim the 1981 level failed, signaling weakness. The 1916 level we previously discussed seems to be within reach. Zooming out, gold appears to be tracing a massive double top pattern.
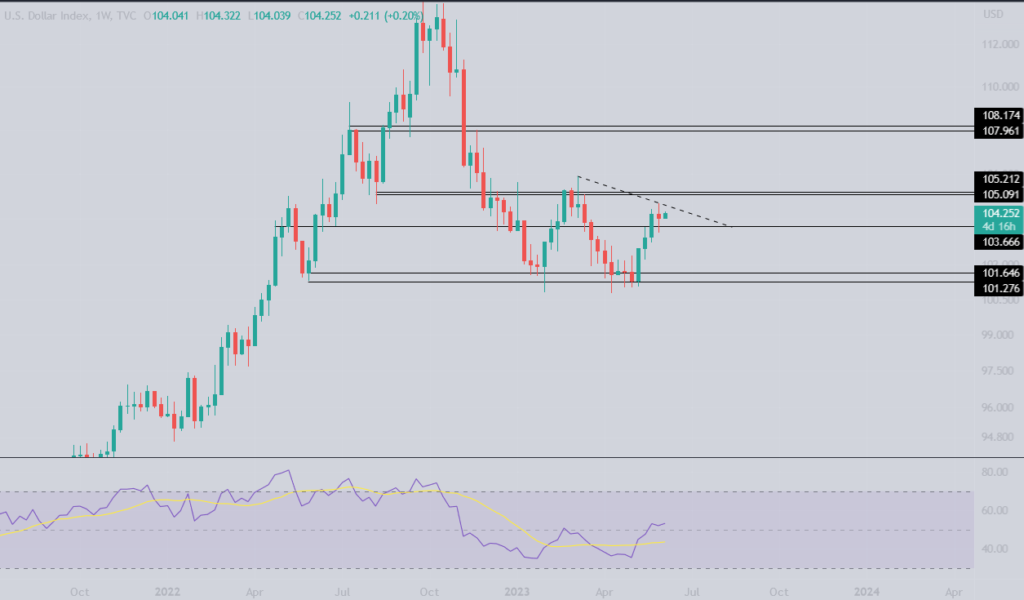
The DXY maintains its uptrend.
After breaking the pivotal 103.66 level, DXY continued its rally. However, it fell short of the 105 level when the debt ceiling was suspended, putting a damper on the Dollar index. I’ll be keeping a close eye on whether we see a lower high here, or if the 105 level is breached, signaling continued strength in the DXY.
Ethereum
ETHUSD
ETHUSD
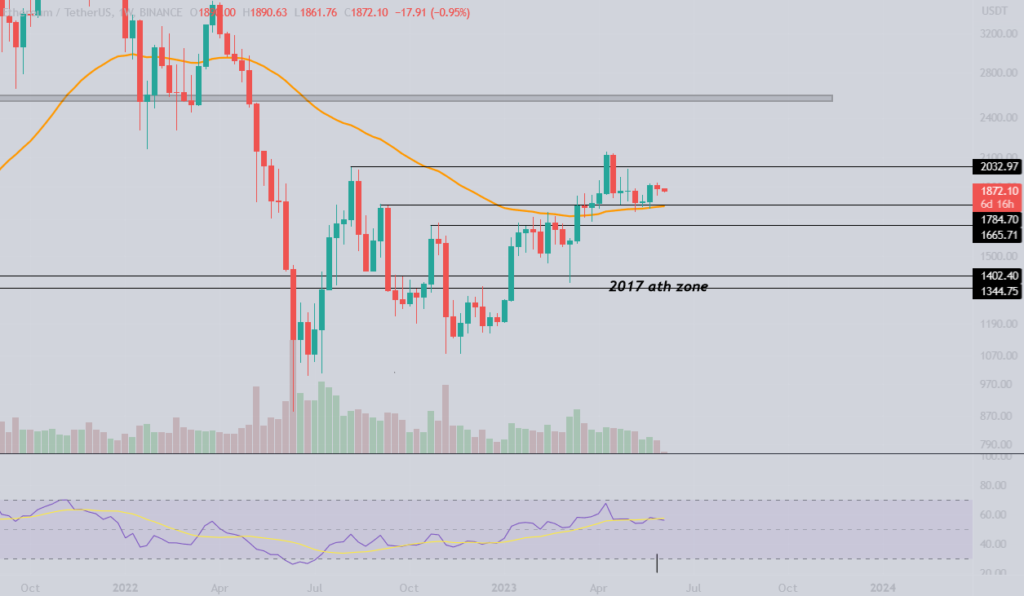
Ethereum/USD seems to be copying Bitcoin’s structure at the moment.
The weekly 50 EMA seems to be providing support, coinciding with the crucial $1,784 level. This is a key level to hold, while the $2,000 mark remains the one to break. Until either of these levels give way, we can expect some sideways action.
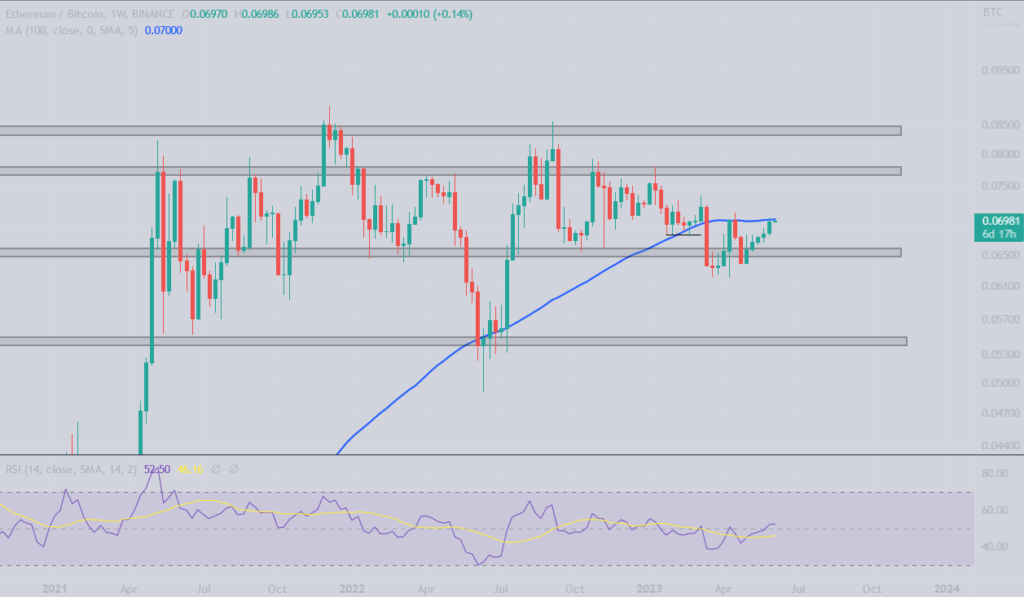
I’ve brought back the ETH/BTC chart, as it’s been showing strength over the past few weeks. It has pushed to the weekly 100 MA, where it was previously rejected in April. Our trade remains profitable for now, and for those with a lower risk tolerance, it might be wise to secure some profits in case we see another rejection at this level.
Blood’s content recap
BTC view from Twitter
“#bitcoin play is pretty simple. Currently sits in a channel, where there is no drama at all.
Two possible scenarios:
1. $BTC breaks 35k, people starts Fomo buying & will be rejected in 39k area
2. Loses 25k sup, people will start biddin’ 10k, but it will bounce from 22k again.“
Where are beginners wrong
“Most newcomers imagine a trader is someone who opens 15 trades in a day, observes 5min candles and uses 50x leverage.
Well, most of these are non profitable gamblers.
You can be a trader with 5 trades in a year. Better to seek for great opportunity than to chase average ones.
Money comes with patience and risk management.”
Concluding notes
When looking at the recent widespread optimism in the stock market, I can’t help but think that it could go much further, but that’s not to say that it will prove to be justified. The thing is, we’re heading into a few months when we’re likely to get significantly lower inflation numbers, but the reason behind that hasn’t got anything to do with Fed policy or even the US economy in general, but simply the way that the inflation numbers are calculated.
More specifically, it’s something called the base effect, and it’s extremely easy to understand, but most people simply don’t think of it. This is how it works: the key datapoint in the CPI is the YoY (year-over-year) inflation number, which is calculated by comparing the CPI for the latest month (next week, that will be for May, as CPI reports for a given month are published during the following month) with the CPI for the corresponding month of the previous year; in this case May 2022. If you remember that May and June 2022 had the highest CPI prints, you might already see where this is going: even if inflation is pretty high over the next couple of months, the number will be much lower than otherwise because it’s being compared to last year’s insane levels of inflation.

