


Bloodgang,
Welcome to this week’s issue of Bloodgood’s notes. The idea of this newsletter is to give you an overview of the previous week’s fundamentals and what happened on charts as well as to remind you of this week’s articles, secret TA tips, and trading calls. Basically, it’s about giving you all the key info in one place.
Table of contents
- Fundamental overview
- Bitcoin and Ethereum chart
- Blood’s content recap
- Concluding notes
As this community grows, I have a duty to give back to all of you that helped me and supported me to become what I am. This free newsletter is just another way to share my experiences and prepare you for the journey that’s ahead of you.
Love,
Blood
Bitcoin catches up with S&P 500, SEC Fud turns out to be a bear trap, 2 leveraged BTC futures ETFs approved and more
Fundamental overview
Well, it looks like Bitcoin finally started catching up to some of the assets it’s most heavily correlated to. While Nasdaq has been in up only mode for a couple of months, Bitcoin’s performance had been lackluster to say the least, but it looks like the SEC FUD really was just a bear trap. This shouldn’t be too surprising given the BlackRock catalyst that we discussed last time, but the situation was made all the more interesting by a new twist: the SEC approved a 2x leveraged BTC futures ETF.
In other words, the SEC thinks that a 2x leveraged ETF is perfectly fine, but they rejected all previous BTC spot ETFs because they’re too risky. You might have a hard time following that logic, but rest assured that you’re not alone—on the bright side, however, this does make it even more likely that they’ll approve BlackRock’s application. Still, we might have to wait quite a bit longer for their final decision: the first deadline for the SEC to decide on the application is in August, but they can choose to extend their review. In the worst case scenario, if the SEC drags the process out for as long as it is legally allowed to, then we’ll have the final decision in February 2024.
As a side note, and in case you missed the news, there’s some fresh geopolitical risk from Russia, following an attempted coup that seems to have been resolved fairly peacefully over the weekend. I won’t cover it in any detail because much would still be speculation, but keep in mind that it’s possible we haven’t yet seen the end of its effects, and that’s something you should definitely keep an eye on if you’re trading oil, and to some extent any assets that are sensitive to geopolitical risk (which means more or less everything).
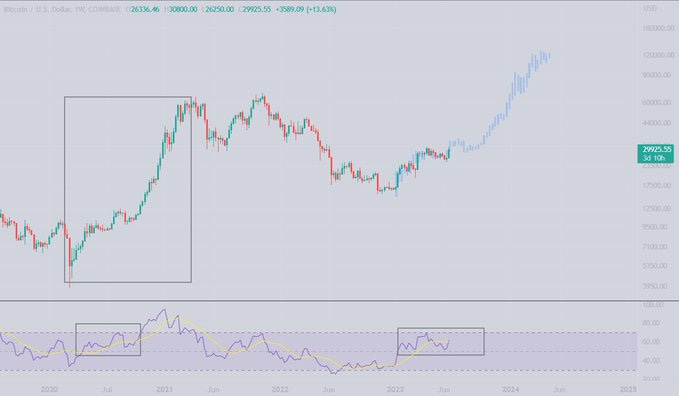
Bitcoin
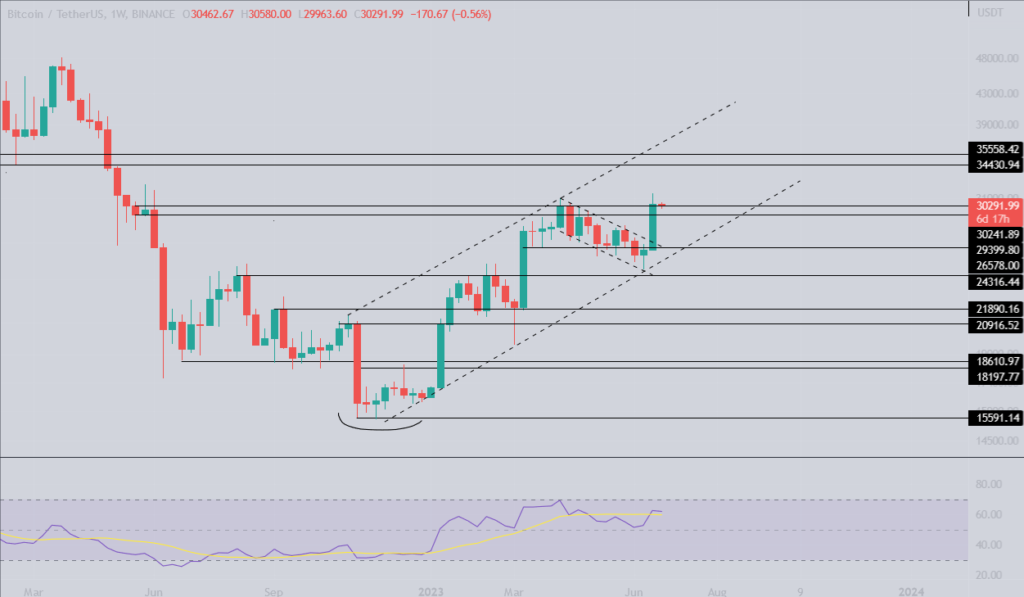
Bitcoin weekly
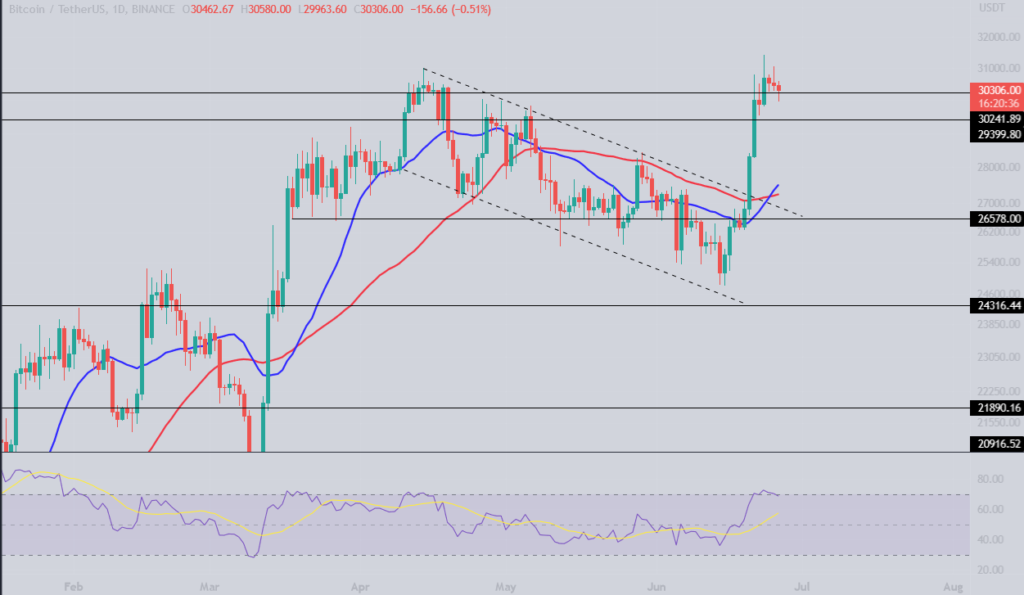
Bitcoin Daily
What a week for Bitcoin bulls!
Bitcoin has printed a 20% green weekly candle, setting new highs, and at the time of writing, it’s trading just above the breakout zone.
The $30,000 mark is a big level both technically and psychologically. The next weekly candle will be key in determining the market’s direction in the coming weeks. If we see a confirmation candle above $30k, we can expect the CME gap at $35k to be filled soon. However, if we see a weekly candle close below $30k, then this was another fakeout, and $24k could be back in play.
The daily chart looks bullish as it retraces back to the level; it remains to be seen if it will hold. Also, remember the swing exercise I shared on Twitter, where the short-term MA crossing above the longer-term MA signals a buy. In this case, the blue 20MA has crossed above the red 50MA.
All in all, it’s been a fantastic week for bulls and day traders, with some much-needed volatility finally making an appearance. But beware, an interesting week is ahead of us.
SPX, Gold and DXY
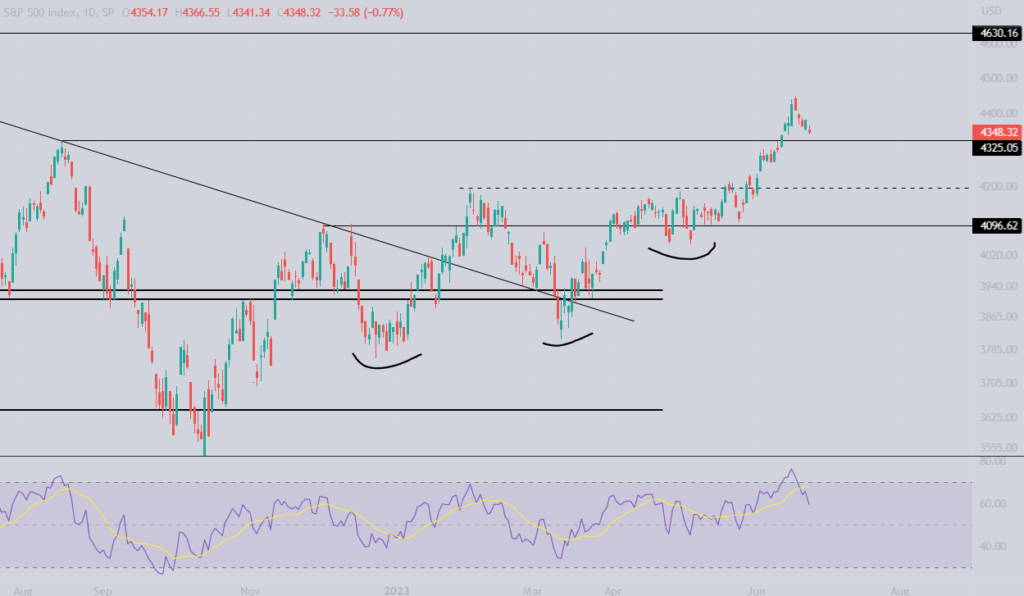
S&P 500
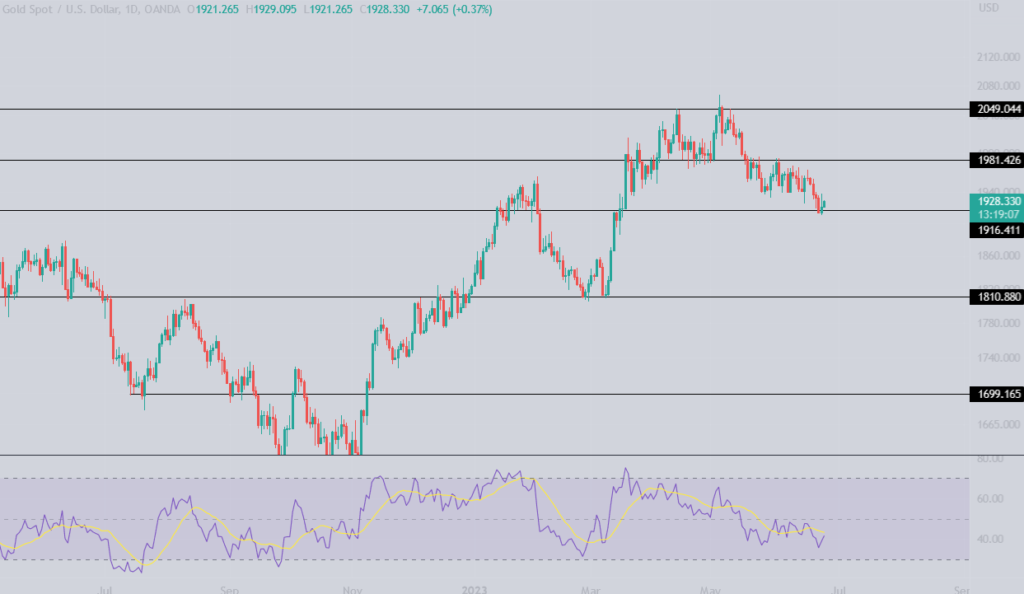
Gold
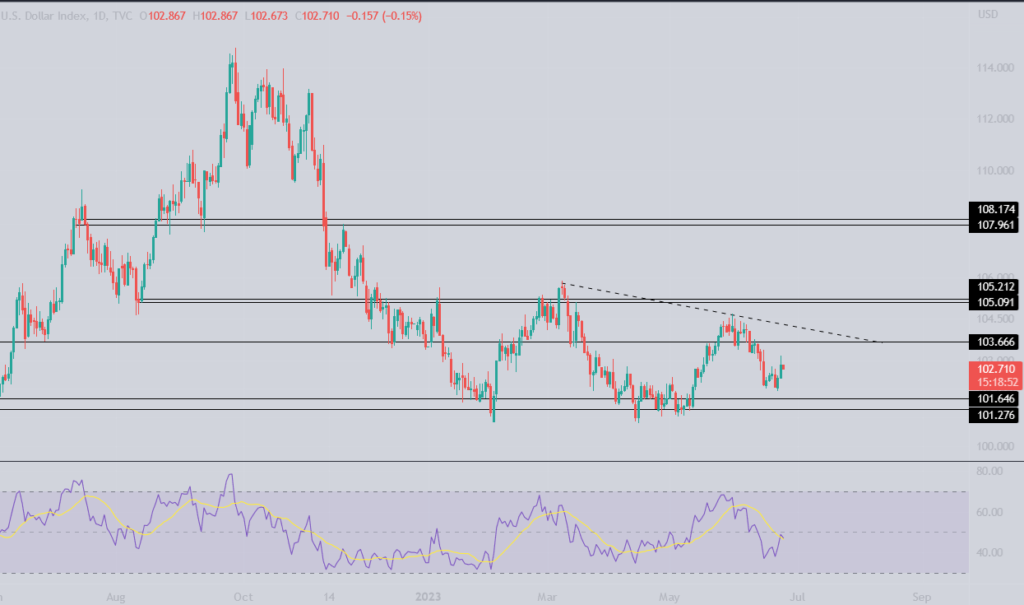
U.S. Dollar Index
The S&P500 is still choppy, going sideways in no man’s land. It tried to form a higher high but failed to break past the previous one, which is a bearish sign. However, as long as the RSI remains above the 50s, we shouldn’t be too concerned.
Gold once again tested the ATH levels and faced rejection at the 2049 level. So far, gold appears to be respecting this range, with the range low at 1981, and the range high at 2049.
The DXY is showing strength at the lows. It appears that the breakdown we witnessed last week was a fakeout, followed by a rally. Anyway, the first level to watch on the upside is 103.66. We don’t want DXY to climb any higher than that if we want risk-on assets to fly.
Ethereum
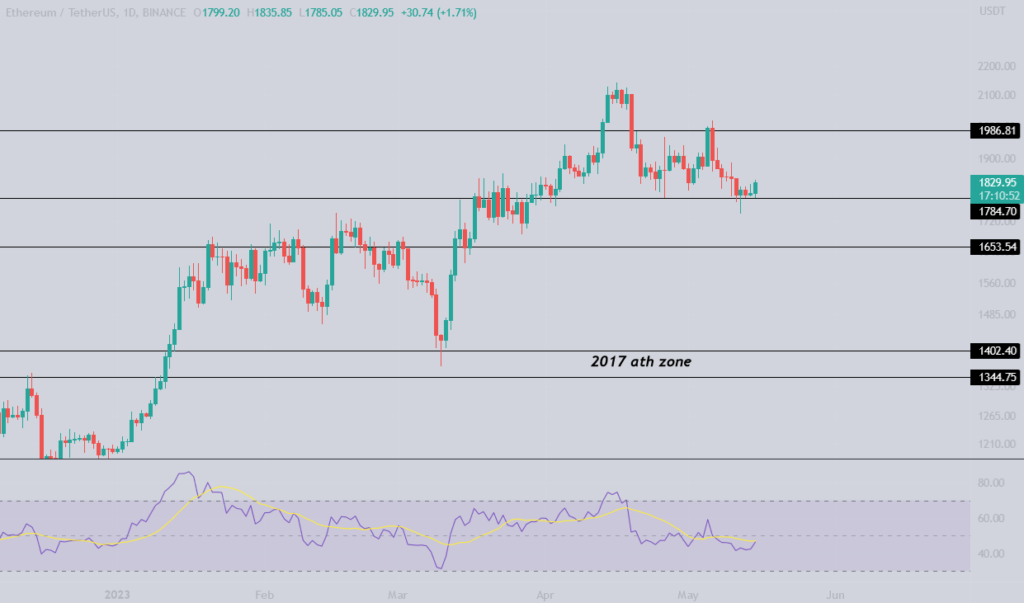
Ethereum Daily
The S&P 500 is cooling off after a big run up.
The 4325 level, which we’ve been monitoring for some time, was finally broken last week, largely due to the AI frenzy. Now, as we retrace back to this level, the strategy mirrors that of Bitcoin. If we hold the breakout zone, we’re aiming for the highs; if we lose the breakout zone, 4096 comes into play.
Gold has finally touched the 1916 level.
After weeks of keeping an eye on the 1916 level, gold has finally dipped to it and provided a small bounce. I’m still not trading gold as there’s no discernible strength here. It’ll be intriguing to see whether the level holds or if we’re heading down to 1810.
The DXY bounces.
The U.S. Dollar Index still has some fight left in it, refusing to break below 101. Given the expectation of lower inflation numbers in the summer due to the base effect and the Fed’s reluctance to raise rates, I anticipate the 101 level to be breached sooner rather than later. A break below 101 would give a boost to risk-on assets, so keep this chart on your radar.
Blood’s content recap
Bitcoin fractal from 2020 coming into play
A wake-up call for all traders
“Holding 10 different coins doesn’t mean your capital is “diversified”.
If you fear you will miss on gains because you have some capital in stables, please leave this industry because it’s not for you.
Most of you are younger than me, so this goes to you.
Invest in crypto.
Invest in stocks.
Buy real estate as soon as possible (start small).
Have money in fiat.
oke?”
Concluding notes
For what it’s worth, there is a reason behind the SEC’s different approaches to futures versus spot ETFs, and it’s precisely the same reason that makes futures ETFs less appealing for Bitcoin bulls. The thing is, with a futures ETF, there’s no trading of actual Bitcoin going on. Everything is just cash-settled futures, without a single private key or Bitcoin wallet involved. A spot ETF, on the other hand, does hold actual spot BTC. The difference is somewhat similar to trading derivatives on gold (no actual gold involved) versus trading actual physical gold. To put it in simple terms: you can sell BTC futures without owning a single satoshi (i.e. just using cash margin), but that’s not possible with spot BTC. On top of that, futures ETFs always underperform spot on a long-term basis because of the additional costs involved, which is why long-term investors, rather than short-term traders, will flock to the first spot ETF that gets approved.
So, what do you think will happen to the supply/demand balance of BTC once there’s an ETF that’s available to everyone—from any institutional Michael Saylor-wannabes to the millions of people that would like a bit of BTC exposure for their retirement—sucking in spot BTC like a black hole?

