


A popular tool that technical traders use to identify strategic levels and potential entry/exit points is the Fibonacci retracement method. Here I’ll explain what it is, how it works and how you can apply it to your technical analysis.
The Fibonacci retracement indicator is based on the so-called golden ratio that supports aesthetically pleasing shapes which are found in art, design and engineering. Commonly it is present in natural phenomenon like seashells, sunflowers, atoms and even galaxy formations. For unknown reasons, the Fibonacci ratios seem to play a role in the crypto market as well, just like they do in nature.
Fibonacci retracement levels are used by traders as an indicator to discover areas of interest. On the chart they’re depicted as horizontal lines that indicate where support or resistance is likely to occur. The system is based on Fibonacci numbers, where each term is simply the sum of the two preceding numbers and the sequence goes on into infinity:
0, 1, 1, 2, 3, 5, 8, 13, 21, 34, 55, 89, 144
The percentage ratios are discovered by some mathematical calculation involving this string of numbers. Most of them are defined by dividing any number in this series with the following numbers. The first key ratio is found by dividing a number in the series with the one next to it. For example, dividing 55 by 89 equals 0.61798 and dividing 89 by 144 equals 0.61805. In this fashion, we discover that every number is approximately 1.618 times larger than its predecessor and the first ratio of 61.8% is defined.
The second ratio is discovered very similarly; by dividing a number with the one two spots to the right. For example, dividing 34 by 89 equals 0.38202 and dividing 55 by 144 equals 0.3194. As you can probably guess, the second ratio is 31.2%.
With this process, we can calculate the desired percentage ratios, to which we add 0% and 100% which will be placed on the high and low points of our analysis. Besides the calculated ratio percentages, 50% and percentages above 100% such as 161.8% and 261.8% are also added from time to time. Most often, the Fibonacci retracement indicator will use:
0%, 23.6%, 38.2%, 50%, 61.8%, 78.6% and 100%.
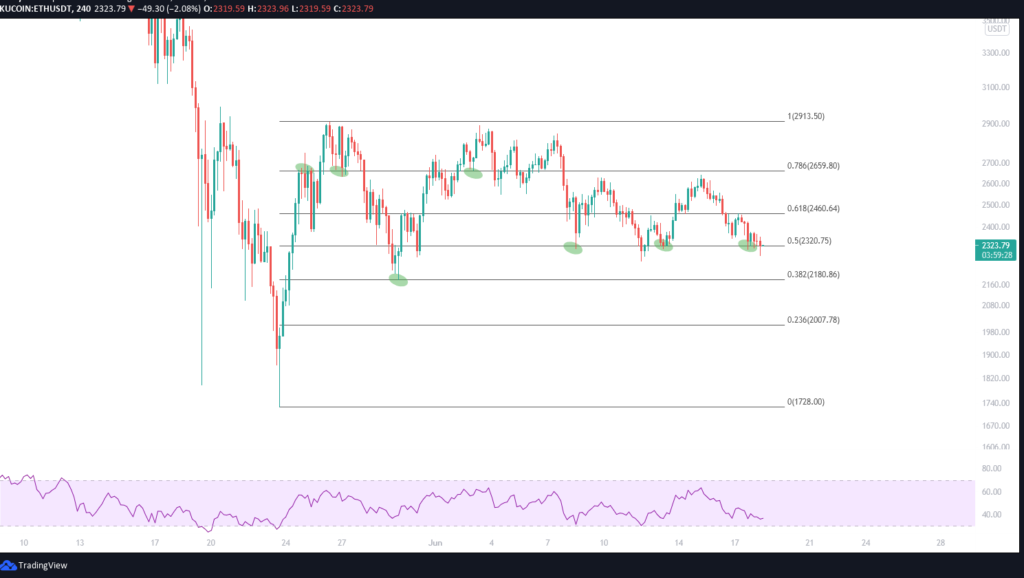
The ratios are then drawn between any two significant price points. Each ratio (including 0% and 100%) is represented with a horizontal line. Typically, the indicator is drawn in accordance with the underlying price trend of the cryptocurrency. If there is an uptrend, the low point will represent 100% and the high point will represent 0% (the rest are drawn between them). If the price starts to retrace, the ratio lines can show support levels that could be retested. On the flip side, during a downtrend, the low point will show 0% and the high point 100%. If the price starts to bounce back, the tool may show potential resistance levels.
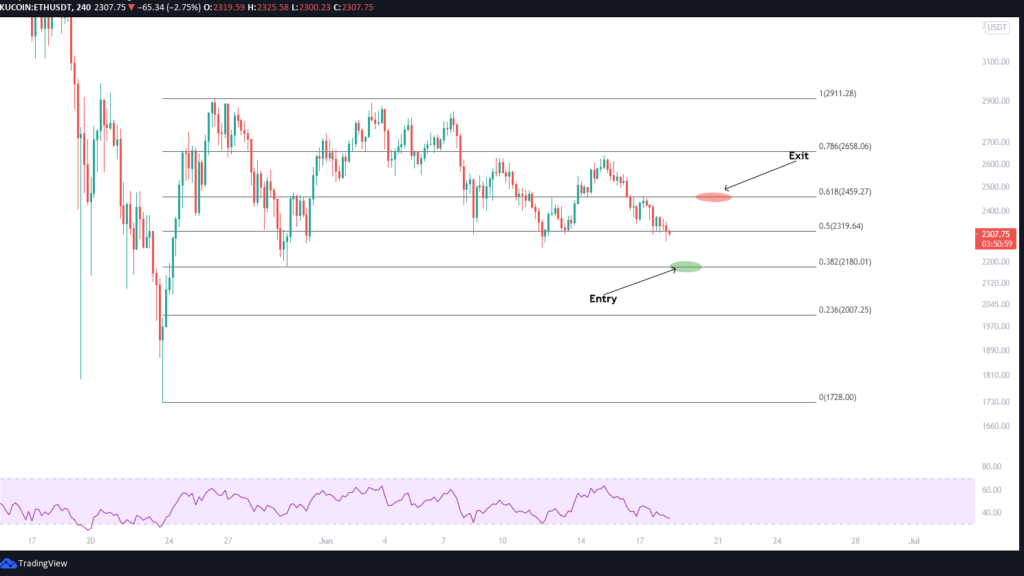
You can use the Fibonacci retracement to your advantage in multiple ways. Most commonly, traders will look at these ratio levels as potential entry or exit points as the price could stall or change direction roughly on that level. You can also seek to profit between two chosen Fibonacci levels or combine it with other indicators such as Elliott Wave Theory to predict the extent of retracements.
While the Fibonacci retracement indicator is very popular, its use is quite subjective and there is no assurance that the price will actually stop on one of those levels. There are also arguments against the usefulness of this indicator, one of them being that there are so many levels present, the price will likely reverse near one of them quite often. A problem occurs when the trader doesn’t know at which level the price will actually stop moving. If he interprets it wrongly, it can always be said that he should’ve been looking at another level instead.
To close this out, I recommend you to combine the Fibonacci retracement with other trading indicators. While the price often really does seem to move in accordance with the ratio, you should never blindly follow the signals of an individual indicator.


Fibonacci is a mystery!
2 question:
1- As you said: If there is an uptrend, the low point will represent 100% and the high point will represent 0% (the rest are drawn between them). If the price starts to retrace, the ratio lines can show support levels that could be retested. On the flip side, during a downtrend, the low point will show 0% and the high point 100%.
But why like this? When it’s uptrend, the low point is the base line, so what if we consider the low point as 0 and vice versa for the downtrend?
2 – The most difficult job is the levels to apply the Fibo. On which leg we need to apply the 0 n 1 of Fibo? What is the best case for this? And sometime we apply more than 1 Fibo on charts, on different legs. So, what is the best way and how?
Tanx uncle BloodG,
Love
Another question: Do we need to apply Fibonacci based on Log scale, or not? As using this option will completely change the whole R/S areas. Am fully confused with Fibo now!!