


Today we’ll take a look at the Relative strength index (RSI for short), what exactly it is, how it’s calculated and how you can use it to level up your trading game.
The RSI is a momentum indicator used in technical analysis (TA), first developed by J. Welles Wilder. Simply put, it measures the speed and change of price movement and signals when a cryptocurrency or an asset is either overbought or oversold. It holds values between 0 and 100 and is typically calculated with 14 periods (more on that later). Usually, it’s plotted as an oscillator (a line graph that reaches values between two extremes) beneath the price chart. Generally, an asset is considered overbought when the RSI is above 70% and oversold when it’s below 30%. In such extremes, one can expect an upcoming trend reversal or a corrective pullback in the opposite direction. We’ll take a look at some examples to show you the practical implications later on.
The formula for RSI is calculated in two parts and is fairly simple yet difficult to explain.
The first part (simple 14-period averages):
RSI = 100 — (100 / (1 + (initial Average gain/initial average loss)))
Average gain = Sum of gains over the past 14 periods / 14
Average loss = Sum of losses over the past 14 periods / 14
The average gain and average loss used in the calculation are the average percentages of gains and losses during the chosen period and the average loss is expressed as a positive value.
The second part (smooths the result):
RSI = 100 — (100 / (1 + ((Previous average gain x 13) + current gain) / ((previous average loss x 13 + current loss))))
Through the second step, the results are smoothed in order to become more accurate, produce less false positives and to extend the calculation period. Once again, the average losses are expressed as positive values.
After the second step, the RSI points can be plotted onto the chart, creating the visualization we stride for.
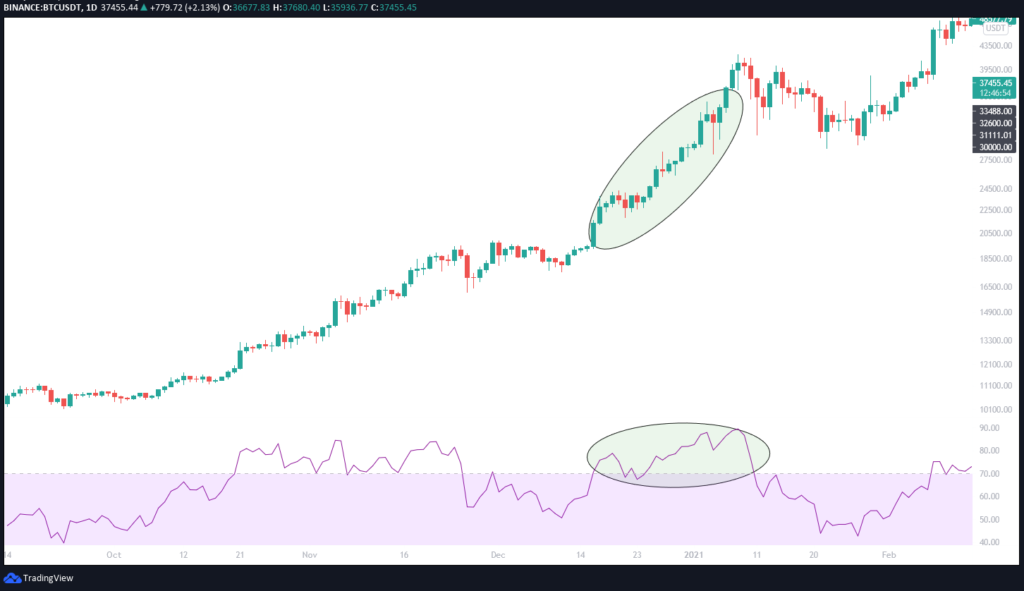
Now that we know how the RSI is calculated, let’s look at what we can learn from it and how traders use it for TA. We’ve said before that when the RSI is signaling that a token is oversold or overbought, we can expect a reversal or a corrective pullback. Despite that, the RSI can and similar momentum oscillators can become overbought/oversold and remain so in a strong up/down trend. We can see such behavior in the Bitcoin example below. Even though the RSI signaled that BTC is overbought for quite some time, the price climbed higher with minimal pullbacks because of a very strong long-term uptrend.
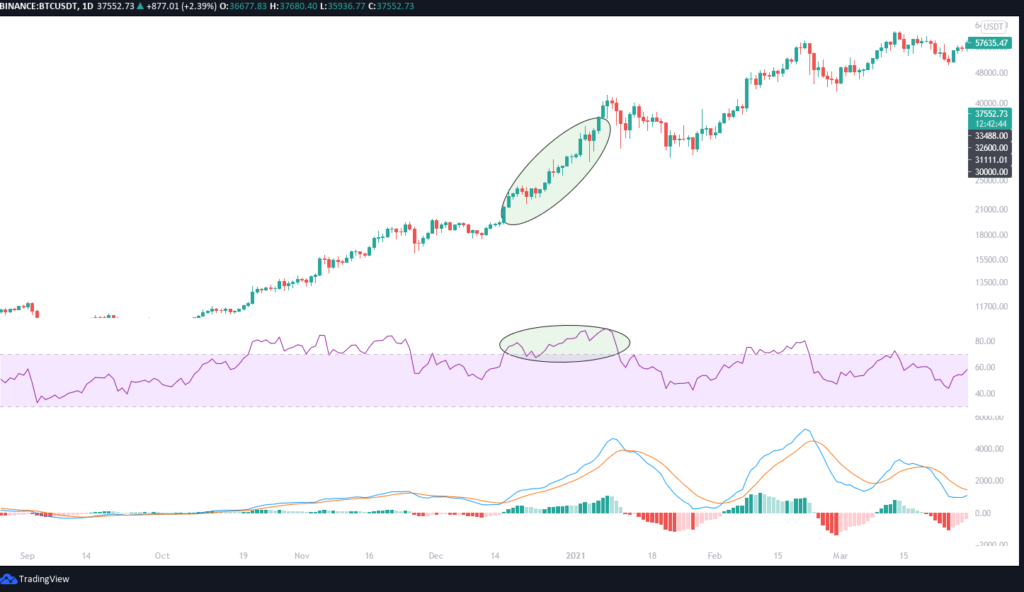
To counteract such false positives, we can combine the RSI with other trading indicators to either confirm or deny the price reversal signal. In this fashion, the RSI is often combined with the Moving average convergence divergence (MACD) indicator which calculates momentum differently from the RSI by comparing the relative positions of a short and long-term moving average. Another popular RSI combination is with Moving average Crossovers, that predict reversals quicker.
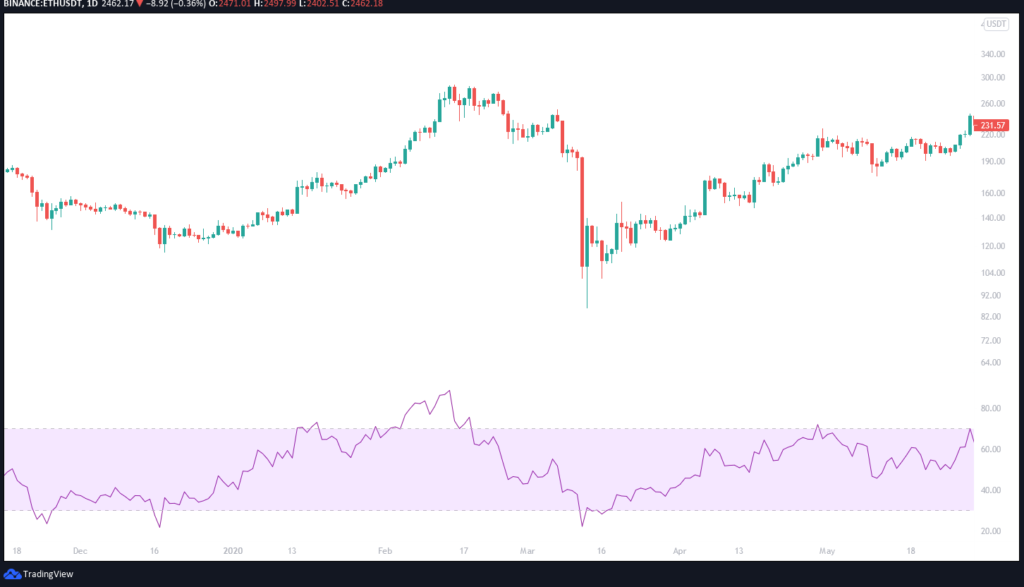
Because of the RSI’s nature of false positives in strong trends, it’s most useful in sideways movement — when the price of a cryptocurrency stays within a certain range. In the example below, we can see that Ethereums (ETH) price moved sideways within the chosen time period. When the RSI signaled that ETH is oversold once towards the end of November and again in the middle of December it correctly predicted the trend reversal that followed in the coming month and a half, when the price more than doubled. At its peak in the middle of February, the RSI almost touched 90%, predicting a trend reversal that followed. In the middle of March when the price reached the bottom again, the RSI dipped under 30%, correctly signaling yet another reversal which followed in the form of a slow but steady uptrend in the following months.
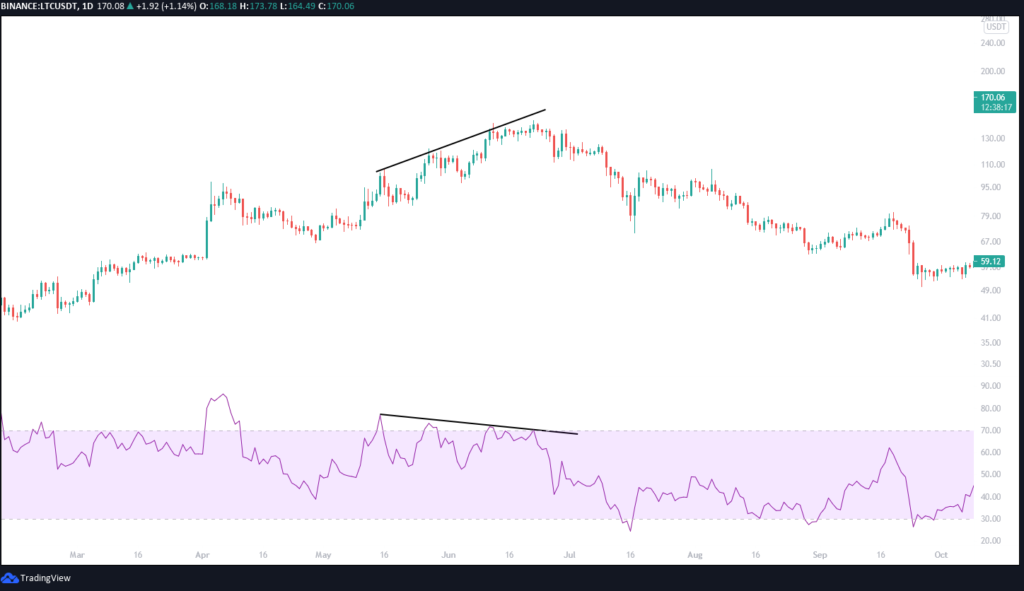
According to Wilder, RSI divergences can also predict potential reversals because directional momentum doesn’t confirm the price. When the price of a token forms higher highs while the RSI forms lower highs a bearish divergence is formed, which signals a potential reversal downwards. On the flip side, when the RSI forms higher lows while the price forms lower lows, a bullish divergence is formed, signaling a potential reversal upwards. A bearish divergence can be observed in Litecoin’s chart below, where the price kept making higher highs and the RSI consistently recorded lower lows. Soon after the overall trend reversed, causing the price to decline over the next three months.
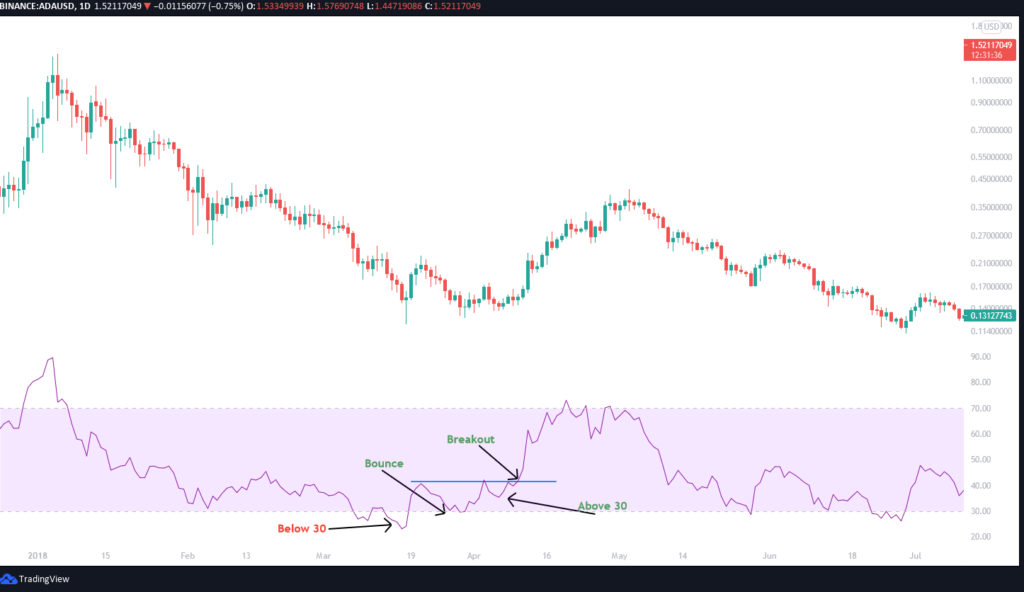
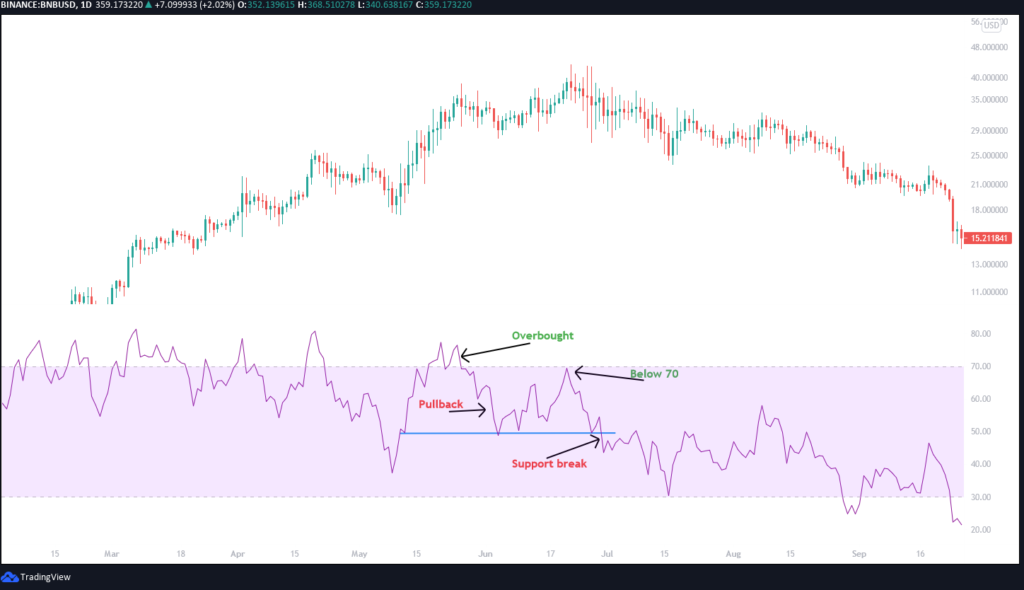
Lastly, the RSI can signal an impending reversal with “failure swings”. They’re completely independent from price action or divergences, therefore we solely focus on the RSI. A bullish failure swing forms when the price dips below 30%, jumps back up, dips back down but holds above 30% and then beats the prior high. Conversely, a bearish divergence forms when the RSI moves above 70%, pulls back, bounces back up but fails to exceed 70% and then breaks the prior low level.
A bullish failure swing can be observed on the Cardano’s graph below, where the RSI dipped under 30%, bounced back above, retraced again without breaking 30% and then barely pushed above the previous high. After the failure swing, the price movement recorded a short term reversal and uptrend we could make a move on.
Binance’s graph depicts a bearish failure swing, where the RSI jumped above 70% while in a price uptrend, then it fell back down and lastly climbed up almost to the 70% but not reaching it again, predicting the upcoming bearish price movement that followed in the next months.
Conclusion
While the RSI is super useful, it has its limitations. Usually it works best and is most reliable when conforming to the long-term trend. Because the indicator shows momentum, it can remain oversold or overbought for quite some time, when the token has significant momentum (a strong, long-term trend) in either direction. Because of this, the RSI is most useful when the price moves sideways, within a price range. As mentioned before, it’s also often combined with other indicators to confirm the reversal signals.


Absolute legend. Really appreciate the free help here. I’ve already learnt so much from this.
Ste
Looking forward to more of these. This is called articulately explaining a topic. Jeez, I’m blown away by how many people can’t do that correctly. This is good; look forward to the book.
Really informative and easy to understand! Thanks 🙂
Perfetto uncle Blood. Best,