Supply and demand is talked about a lot, and you can study entire courses on it. But the principle theory is very simple — people will pay more for something in short demand. However, that something has to be useful or desirable. For example: I have a half-eaten sandwich, one of a kind, in very short supply! But I’m going to struggle to sell it for any price, let alone a high price. That’s because there needs to be an active (or potential) market for what you’re looking to sell i.e. evidence that it has sold before or reason to believe it will sell in the future.
The other phrase you’ll hear more and more on Crypto Twitter is ‘supply shock’. It’s a simple phrase, but its meaning is not always intuitive to new traders I talk to. Let’s state straight away that it’s not just an emotional response to seeing something in short supply. By Investopedia definition:
“A supply shock is an unexpected event that suddenly changes the supply of a product or commodity, resulting in an unforeseen change in price.”
In other words, a step-change in supply leads to a step-change in price.
Where has all the toilet roll gone?
During the pandemic last year, some places reported mass shortages of toilet roll in supermarkets due panic buying, which only got worse as people rushed to get the last of the supply. Is this a supply shock? Well, technically, it depends if the price changed significantly.
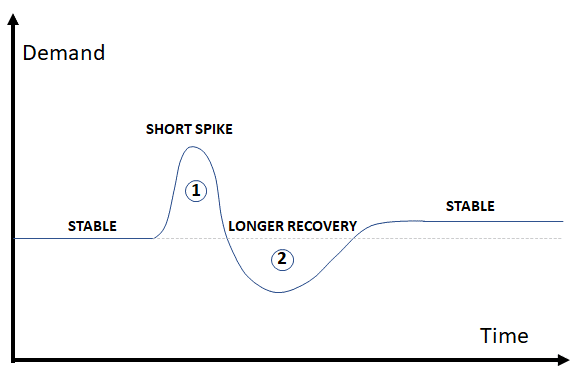
When the spike in demand happens, retailers ask the supply chain for more and the manufacturers have to decide whether they can and/or should ramp up production. For example, if the manufacturers can only get additional wood pulp at higher prices they will pass the cost back down the chain to the customers and this may then be considered a supply shock. With consumables like toilet paper, there will then be a big correction in demand while everybody uses their stockpile, before it recovers to a new, stable level again.
So is Bitcoin like toilet paper?
Not quite. Some key supply differences to keep in mind here are:
- Bitcoin is not a consumable, in that it cannot be destroyed
- The Bitcoin supply rate via mining is fixed in code and cannot be altered
At this point though it’s important to make the distinction between Total Supply and Circulating Supply:
- Total Supply — there will only ever be 21 million Bitcoins that exist (aka the maximum supply)
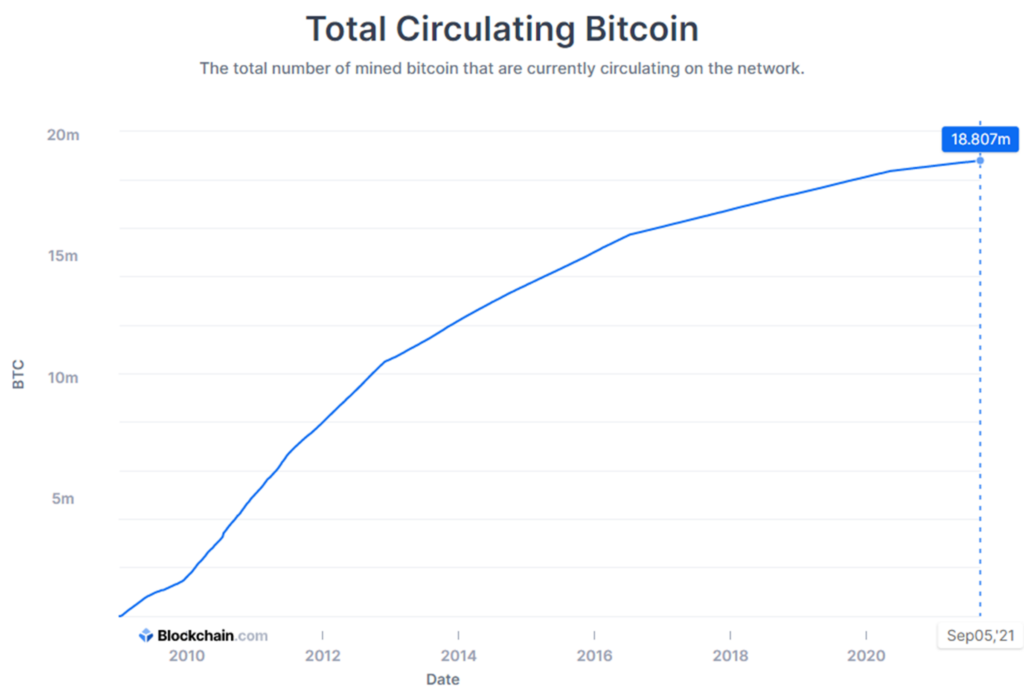
- Circulating Supply — there have been ~18.8 million Bitcoins mined to date (the current supply)
As is well known, the rewards for successfully mining a block reduce approximately every four years (the ‘halving’). And one might be tempted to think that as miners become less interested in lower pay it will take longer to mine a block and fresh supply will slow down even more. But the beauty of Bitcoin’s code is that as the computer hash power on the network drops, the difficulty of mining reduces too, all to try and keep block mining at around 10 minutes.
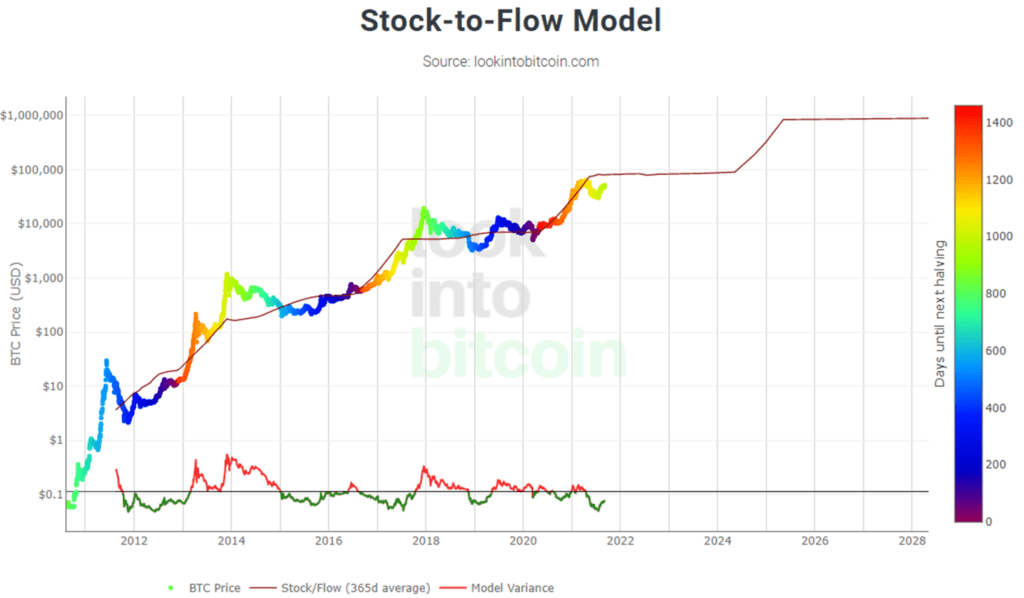
This results in a predictable flow of new Bitcoin into the market, and is one of the key elements in Plan B’s famous stock-to-flow model (which is a ratio representing how long it would take for the current ‘flow’ to replicate the current circulating supply, or ‘stock’). You can find this chart on many websites, including Look Into Bitcoin.
Not all Bitcoin is for sale though
Circulating supply gives us some information but is not as useful as what I call Effective Circulating Supply, or what Willy Woo calls ‘Available Supply’. You can look at unavailable Bitcoin on different timescales, with the extremes being:
- Long-term idle: coins that may be inaccessible (‘lost’) due to loss of passwords or private keys (this is estimated at ~3 million!), or coins in wallets of long-term hodlers. The longer they don’t move, the more likely they’re not available.
- Short-term exchange movement: the number of coins on exchanges and the rate at which they are being deposited or withdrawn may provide clues as to imminent market movement.
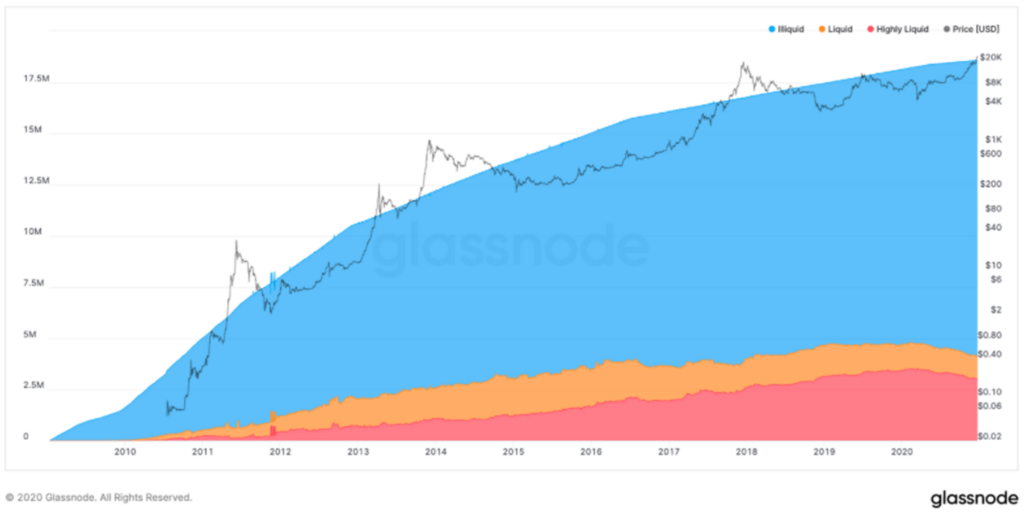
Glassnode has three categories of liquidity for Bitcoin based on how often it moves: Highly Liquid, Liquid and Illiquid. An address falls into one of the categories depending on the ratio of cumulative outflows to cumulative inflows — the higher the number, the more liquid it is. The most revealing thing about analysis done last year was that more than 75% of Bitcoin is classified as highly illiquid (blue on graph below) and not for sale!
The On-Chain Game
On-chain analysis is not perfect and should not be used to solely justify your investment and trading decisions. But it can be one of a number of tools when you’re looking for confluence. Looking back at prior market moves shows that sometimes on-chain analysis acted as a warning signal and sometimes it didn’t.
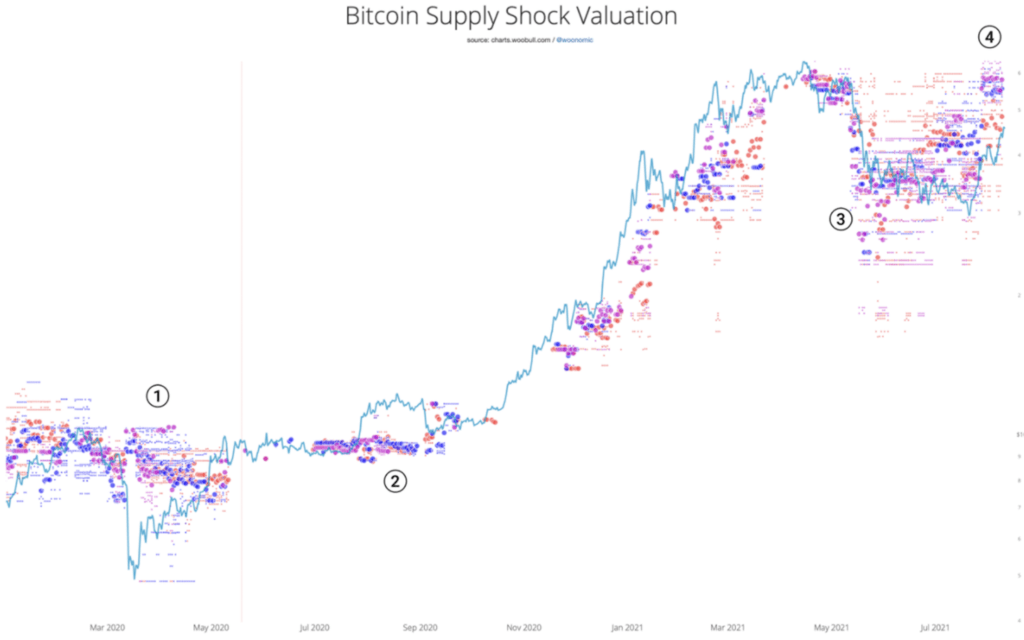
Willy Woo issued a paper last month with a supply shock model that did not predict the March 2020 crash or August 2020 spike (points 1 and 2), but did act as a leading indicator of the May 2021 crash and the late-July 2021 upturn (points 3 and 4).
The intention of this article was to discuss supply shock and so we have primarily focussed on supply. But don’t forget the demand side of the equation. Yes, we know that market participants will treat Bitcoin from a quick speculative gamble to a long-term store of wealth, but demand is a combination of desire and up-to-date information. The market isn’t perfectly in sync, and if you can tap into supply and demand information before the market has had time to react, that is definitely one way to get an edge.