

Simply put, the Moving Average Convergence Divergence (MACD) is a trend-following momentum indicator. To calculate the MACD, the 26-period exponential moving average (EMA) is subtracted from the 12-period EMA, and if you want to read more about these MAs, check out my previous couple of blog posts. As a result you get the MACD line (shown as a blue line in the graph below). On top of the MACD line, the “signal line” is plotted (shown as a yellow line on the graph) that is calculated as a 9-period EMA of the actual MACD.
The MACD and signal lines are then used as a technical trigger to either buy the asset when the MACD line crosses above the signal line or to sell the asset, when the MACD crosses below the signal line (also shown on the graph below). In addition to crossovers, the MACD can be interpreted in several ways, but the most common ones are crossovers, divergences and rapid rises/falls.
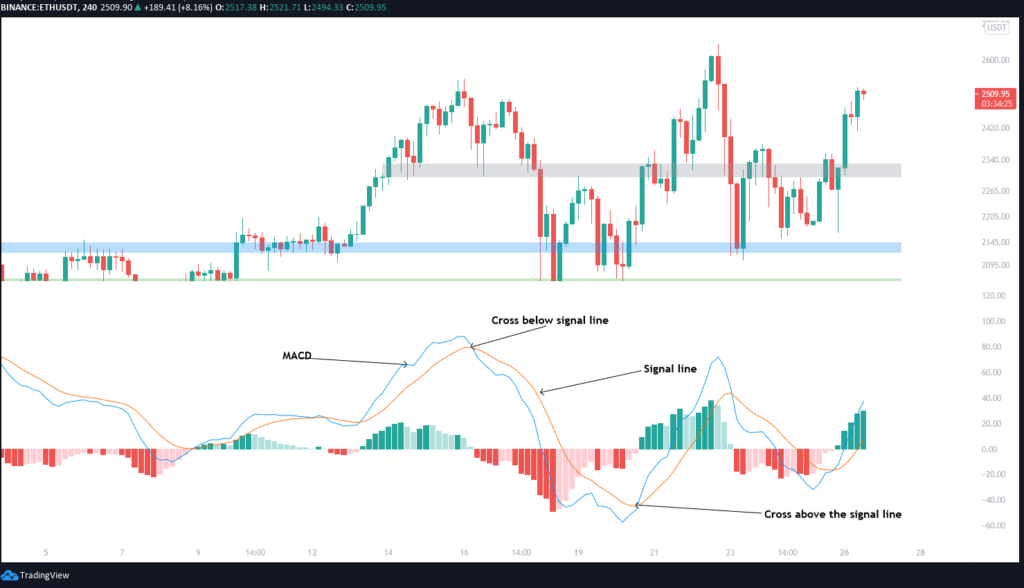
The MACD can have a positive or a negative value. It’s positive when the 12-period EMA is above the 26-period EMA and negative if it’s below the 26-period EMA. Usually you’ll also see a baseline, which indicates the value 0 for the MACD. Besides the MACD line, the signal line and the baseline, there’s also a histogram which displays the distance of the MACD line from the signal line. If the MACD is above the signal line, the histogram will be plotted above the baseline, and if the MACD is below the signal line, the histogram will be plotted blow the baseline. You can check the MACD’s histogram to see if the bearish or bullish momentum is high.

While MACD is a solid technical trigger, it is often used together with other indicators or signals such as Relative Strength (RSI) and a 20-period Simple Moving Average (SMA), because it has a few problems like producing a false positive signal for a reversal and not forecasting all reversals.
A false positive signal often occurs in two scenarios:
- when the price of an asset moves sideways (eg. in a range or in a pattern), because the distance between the distance between 26-period MA and the 12-period MA (which is exactly what the MACD is measuring) narrows
- when the price of an asset is gapping higher and then accelerates upwards, which causes the MACD to jump and since the gapping can’t be sustained, a divergence occurs despite the trend only slowing down instead of reversing
A few more tips for using the MACD indicator:
- always utilize price action (the ultimate indicator) together with divergence (a momentum indicator that’s based on price data)
- if a divergence occurs, don’t exit your trade just because of the divergence as it does not always result in a reversal, so always look for confirmation on other indicators, trendlines etc.
- if you’re looking to enter a trade based on a divergence, wait for the price to break the trend so that it confirms the divergence
- expect to see divergence when the price movement slows or moves sideways, but this isn’t always a reliable signal


Wanted to let you know that your work is appreciated. I am new to stocks/crypto and what you do along with a few others are really helping out. Much appreciation to you. Good luck to you along the way and looking forward to learning as much as I can.
Wowww, bin einfach nur baff. Vielen Dank fürs Teilen ihrer harten Arbeit und damit gewonnenem Wissen. Es ist so als ob sich das heilige Gral vor einem ist und wartet das seine gaben die Menschen erreicht. Hut ab Bloodgood, es ist ein adliger und ehrenhafter Akt. Wir die wissenshunhrigen stehen tief in ihrer Schuld. Vielen Dank für alles.