

Support and resistance (S/R) zones are the first things every trader should learn before jumping into the markets. S/R are horizontal zones where the price might reverse due to strong buying or selling pressure. Mastering S/R strategy can make you rich, but you need to use them appropriately and more importantly stick to your plan. Throughout the years of trading I noticed that many traders draw their charts correctly, but in the end they do not stick to their plan and end up losing money.
Lets quickly look at the definition of S/R and look at examples.
- Resistance ~ How to spot SELL signals
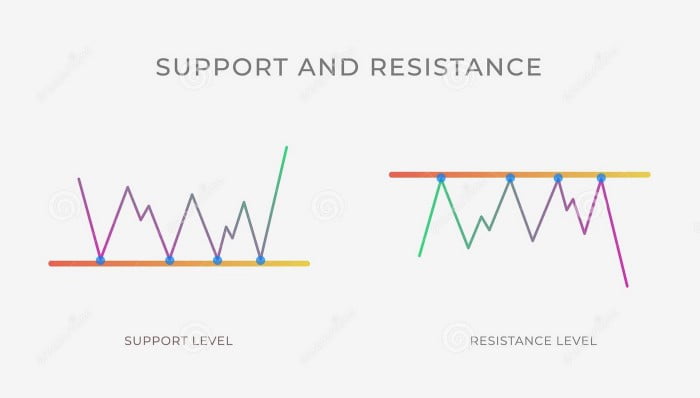
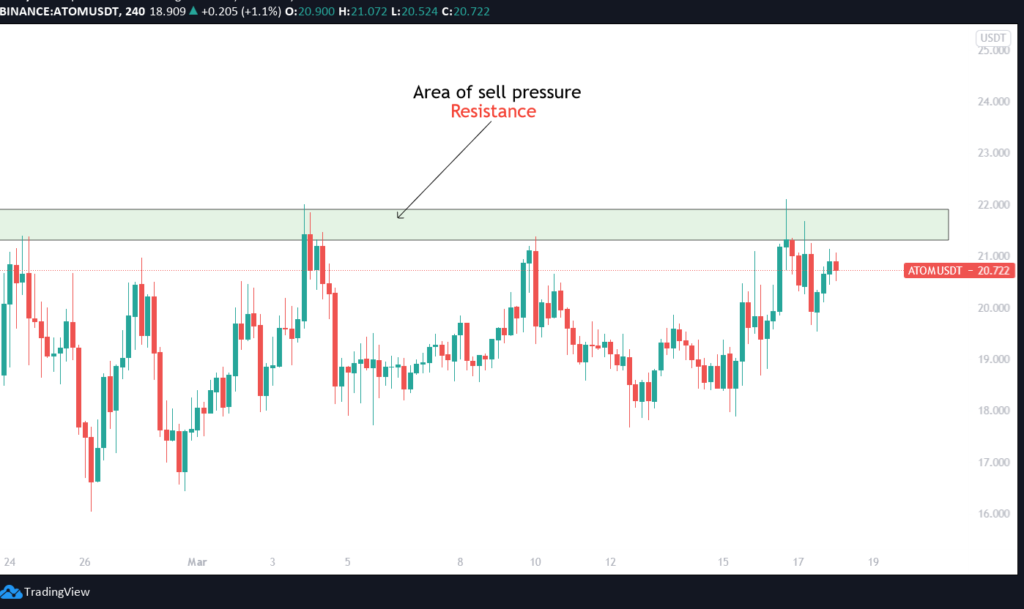
A resistance zone is usually where price tends to fall because there is potential selling pressure (Picture 1). Many traders use this strategy and sell at resistance, and that’s why there is big selling pressure at resistance zones and prices find it hard to break through and rise above that level. If the price is supposed to fall you should place your take profit right before the resistance. Again remember, no matter how fast or slow the price is climbing you should always stick to your strategy. If your strategy didn’t work, look back and think of where it went wrong.
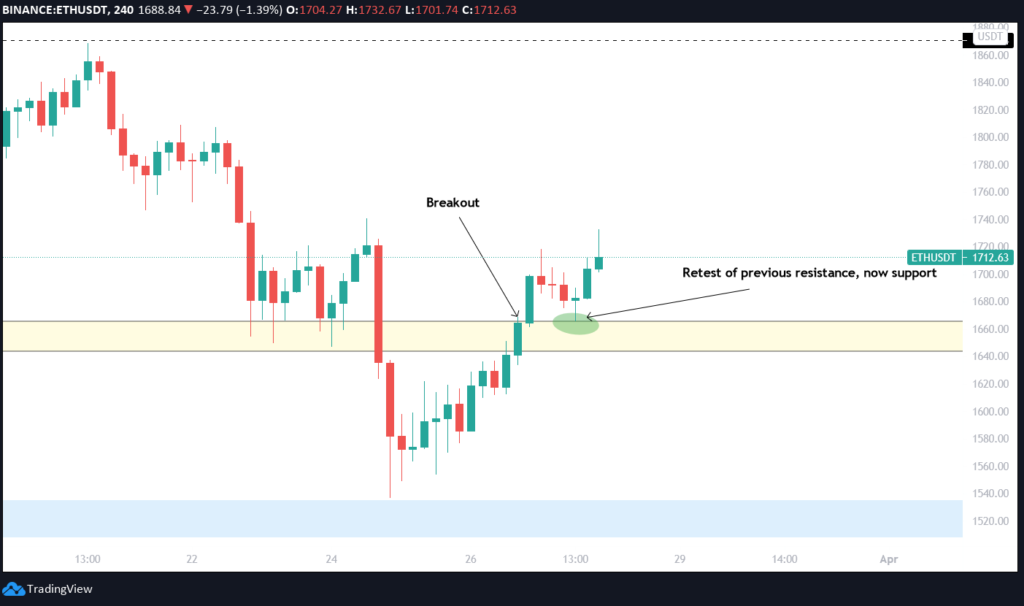
When the price is rejected at a resistance level you should always anticipate that it will drop to a support, however this might not happen. It doesn’t matter, selling at resistance and placing bids at support zone is the best strategy you can have. If price breaks above the resistance, you should wait for a retest of the resistance (now support) and buy on the retest. Look at the picture 2, I would buy at the green zone.
2. Support ~ how to spot BUY signals
A support zone is usually where price finds difficult to fall below until it eventually fails of course. However, we should anticipate that the price will bounce from that level because there is strong buying pressure there (Picture 3). If you are entering a trade at a support level you should always place stop loss below the support zone.
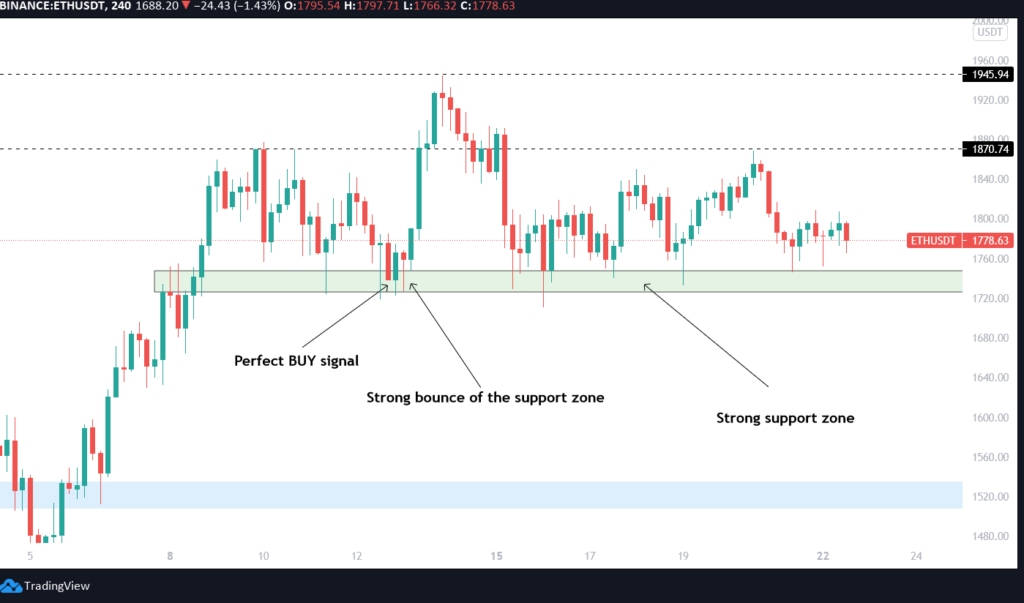
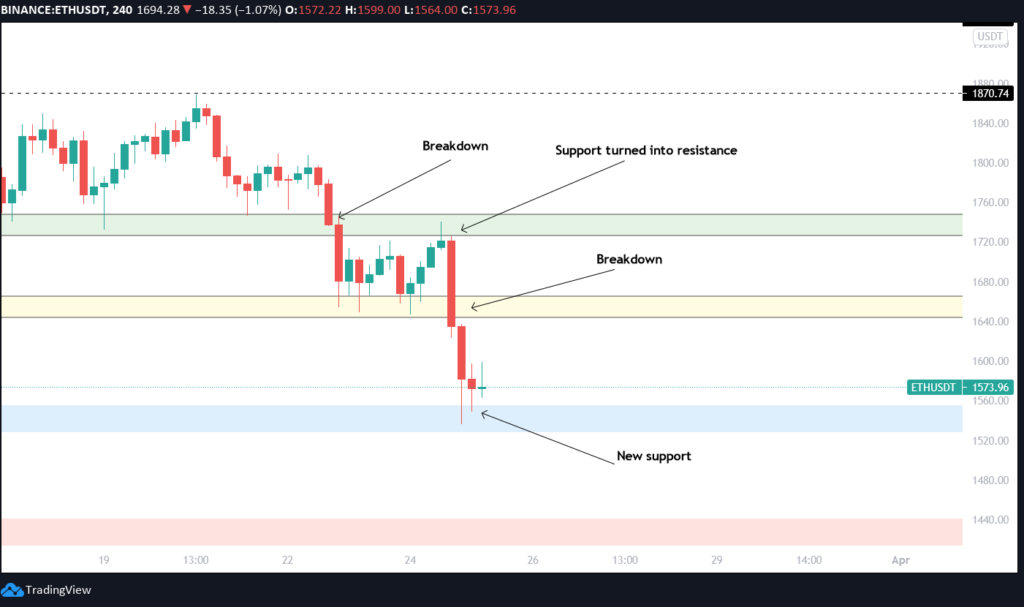
Support zone is the best buy signal you can have, however you must be ready for it to fail and the price to fall below to the next support. You need to keep in mind that if support fails and price breaks below support (breakdown), then that support level can become the new resistance level (Picture 4). This is why having a stop loss is a must.
3. How To Recognize Support and Resistance
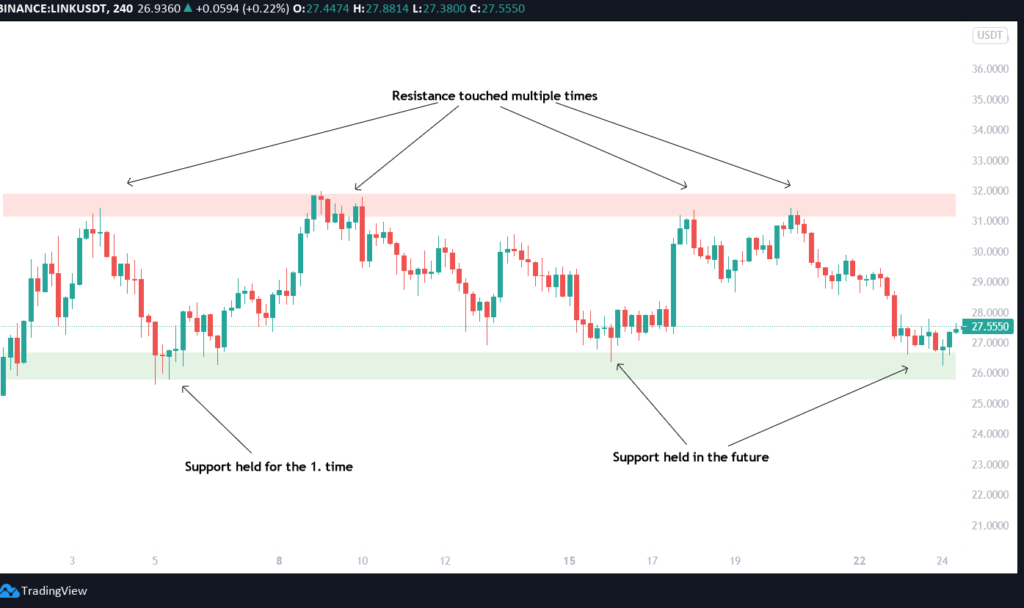
Now that you understand the basics of S/R we should address how can you identify S/R zones. You will need to study the chart, period. Many traders don’t take their time to study the charts, so they fail. On the chart, look for a series of points where the price rises to a certain level, but cant go higher. That’s a resistance level. And then look for low points where price falls to, but doesn’t fall lower. That’s your support level. And then simply draw zones.
The more touch points you have the stronger the zone is. Also, I personally use the 4 hour time frame (TF) to trade. I would not suggest that you draw resistance and support zones on a lower TF, like 30m, 15m and 5m. The higher the TF, the better. Start with drawing zone on a daily chart and then slowly go to lower TF (4 hour, 1 hour).
4. Breakouts & Breakdowns
As mentioned above, when a certain zone fails we get a breakout, or breakdown, depending on the direction the price is breaking to. Why does this happen? Like we mentioned above, the more times the price hits a certain level the stronger the zone gets and more people will place sell orders at that level. But sometimes an asset has good fundamentals, it simply gets more interest or some big players recommend it. Demand for that asset goes up, buyers are entering and sells at resistance zones get eaten and we get a breakout. You can also notice breakouts based on the volume getting higher while approaching resistance, but we will cover that in the next article.
Same thing can happen at a support level. Breakout can also happen to the downside and its called breakdown. As mentioned above, many traders have stop losses set right below the support zone, so if the selling pressure is big at a support zone, traders will be stopped out which results in even more selling. Breaking below the current support will most likely take an asset to the next level.
A short recap on what keep in mind when trading S/R zones
To sum up this short article lets go over the most important things to remember when trading SR zones.
- Support and resistance are zones on your chart
- The more times the SR is tested, the weaker it becomes.
- The higher time frame your find the SR zone, the better
- Place stop loss below the support level
- Place take profit right below the resistance level
This is it for support and resistance zones, I hope you learned something new. If you have any questions my DM’s are always open and if there is a specific topic that you would love to learn about, let me know.


nice one bro
Excellent read!! Highly recommended
I started trading in January 2021, I am familiar with the concept of support and resistance but I was curious about how you will present that topic. It’s great and written in a way that makes me want to learn more about it. Can’t wait to improve my skills and work hard to become a better trader !
Just start reading your site, and appreciate the content already – so good you do this for beginning traders like me.
Wow Such simple and crystal clear explanation of the most important topic
Thanks Blood
#bloodgang
Useful info
How to draw line on support and resistance zone
Thank you, BG. Good to have a refresh on the basics.
Nice one bro. Many thanks i think most people and and speaking on myself that looking to be a gem hunter and what criteria should follow to assess an whether this project is great or not. I think also after studying this would be great for a lot of us and not to full i a rug/scam project. It would be really great Sir if you could guide/teach us this. Any thing is much appreciated and thank you for your help.
Beautiful website Blood. Congrats.
Excellent website, superbly written and understandable even for a pleb like me. Thank you so much.
Great content. Following you a while ago. Thanks for this valuable content. All articles are well written and full of knowledge. You are very precise in your thoughts and concentrated. That’s is how your mentor should be.
yea nice one sir
I read twice and translate to my language, greatly good article
I will read again and again until I got understanding
Love brotha. You are just amazing!
Ur doing it great! Thank u for all of these tips!
I love how you explain everything is such a concise way. Massive fan!
Excelent article. Concise and complete.
I just start learning after loosing some of my capital , I found your presentation very useful and informative .
Thank you for the great effort.
excellent very clear thanks very much