

Trendlines are one of the simplest and yet one of the most important tools used by all t when traders. Whether you’re trading stocks, forex, crypto or soybean futures, you need to understand trendlines.
Luckily they’re not that difficult, so even if you don’t have any previous knowledge you’ll be able to understand them fairly quickly, so let’s dive in right now. A trendline is simply a line that you can draw on a chart and which touches a succession of lows or highs. If it touches the lows, then it acts as support, and if it touches the highs, then it acts as resistance. Many of the things we said about horizontal S/R levels also apply to angled trendlines, in terms of retests and S/R flips.
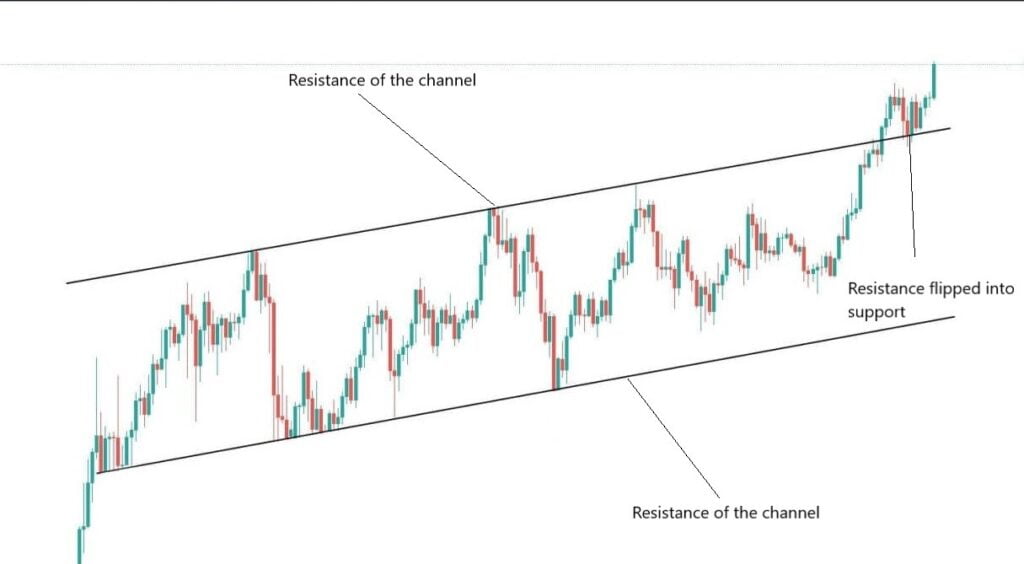
Here you can see an example of a trendline that acts as resistance for some time, gets broken on heavy volume, and then becomes support:
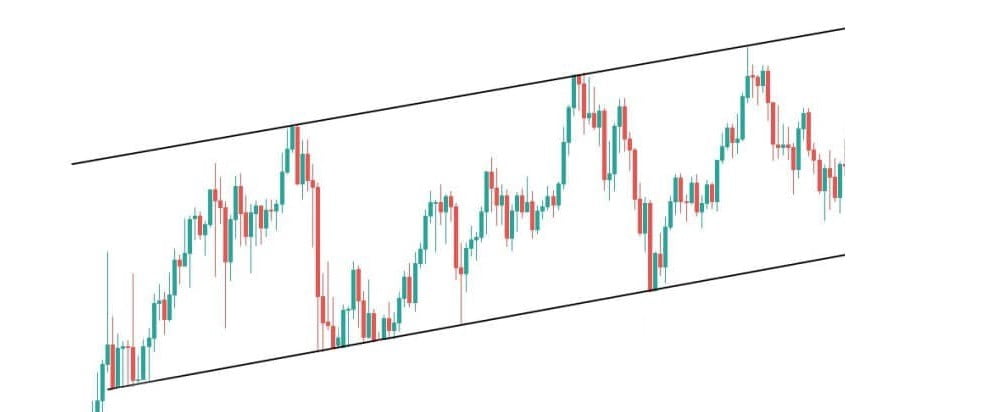
The thing is, trendlines often form patterns. If you have two roughly parallel trendlines, then you have a channel. Here’s an example:
So how do you trade trendlines?
If a trendline acts as support, then that’s an opportunity to buy when the price is very close to it, and you can set your stop loss relatively close to the entry, but ideally you would manually close it if the candle (on whatever timeframe you’re using) closes below the trendline. Different traders use different criteria for when a trendline is invalidated (and with it your trading idea), but two common rules are looking for a close below it (or above if you’re looking at resistance) or looking for two consecutive closes below/above (since just one close can be a deviation that reverses very quickly).
If a trendline is resistance, then you might want to sell when the price approaches it. If it breaks through and reclaims it as support, then you can buy again.
With channels, a good strategy is to buy support and sell resistance until the channel is invalidated. When the price breaks out (either up or down), then you can close the trade and watch for a new entry if previous support becomes resistance or vice versa.
Conclusion
Overall, no matter how you’re trading them, trendlines are much more reliable on higher timeframes. A trendline formed on the daily or even weekly timeframe is much more likely to hold than a trendline on the 5-minute chart. Of course, you won’t get opportunities for an entry as often as you would on the lower timeframes, but it pays to wait it out.


Well said uncle Blood. Thanks brotha 🙂
Love,
Good job bra
I love this, thanks for sharing, bless u 😘