

One of the most popular strategies in trading is to look for breakouts. But trading them isn’t as easy as it might seem, so here are some tips that you need to keep in mind if you want to do it right. I remember losing a lot of money early on by getting in either too late or too early, so I hope this will prevent some of you from doing the same.
First of all, what is a breakout?
A breakout is simply a move outside of a particular pattern or structure. It can be either bullish (breakup) or bearish (breakdown). Here we’re going to look at bullish breakouts, but everything I say here also applies to bearish ones, just in the other direction.
Typically, a breakout is confirmed when the price closes outside of the pattern. So don’t rush in as soon as you see the price above a neckline of an inverted head with shoulders or the upper trendline of a triangle, for example. That candle can easily turn into a wick, and you’ll be left looking for the cheapest ramen at the grocery store.
There are, however, some patterns where it’s possible to enter before the close, primarily bull flags. However, this is a bit riskier and you should first master the simpler trades where you do wait for the close.
Then, when the candle closes and confirms the breakout, there are several things you can do. If it’s still somewhat close to the trendline, you can enter with a small position immediately. Otherwise, if it’s already a bit too high, set bids at the retest of the trendline or an important Fibonacci level.
More often than not, you’ll get it. Here’s an example:
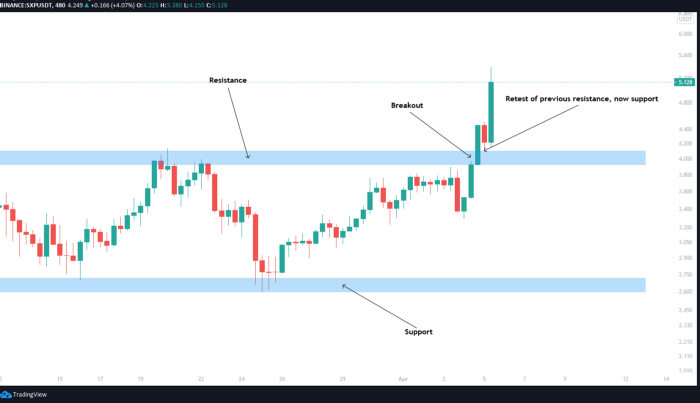
If the price is moving fast, especially if it’s a news-driven pump, there’s one handy trick you can do. As soon as the pump starts to retrace, set bids at the 0.382 Fib level, and a stop loss just below 0.618. Alternatively, if you’re watching the chart just as it’s starting to break out, you can enter immediately and set a stop loss just below the trendline.
All of this has an impact on how big of a position you should open. If your stop loss is 2% below, your position can be 10 times larger than if it’s 20% below, while keeping the risk the same.
That’s it for some basics, I hope it helps you make better trading decisions rather than having to learn all these lessons the hard way. Good luck!

I appreciate this
I will apply this on my trading setup
Huge thanks for the work your doing , i hope i can learn to trade better.
Great thank you. Any videos on how to use Fibs properly would be much appreciated as well !
I would greatly appreciate that as well. Thanks for all the help, Blood.
Thank you Blood, you’re great
When adapting this strategy, which time-frame do you use?
Perfetto uncle Blood. Would be appreciated if you kindly show as example on chart for this:
As soon as the pump starts to retrace, set bids at the 0.382 Fib level, and a stop loss just below 0.618. Alternatively, if you’re watching the chart just as it’s starting to break out, you can enter immediately and set a stop loss just below the trendline.
Tnx brotha. Love,